User Interface
Overview
The correlation UI is a web client that allows you to build correlation queries, execute them, and display their result.
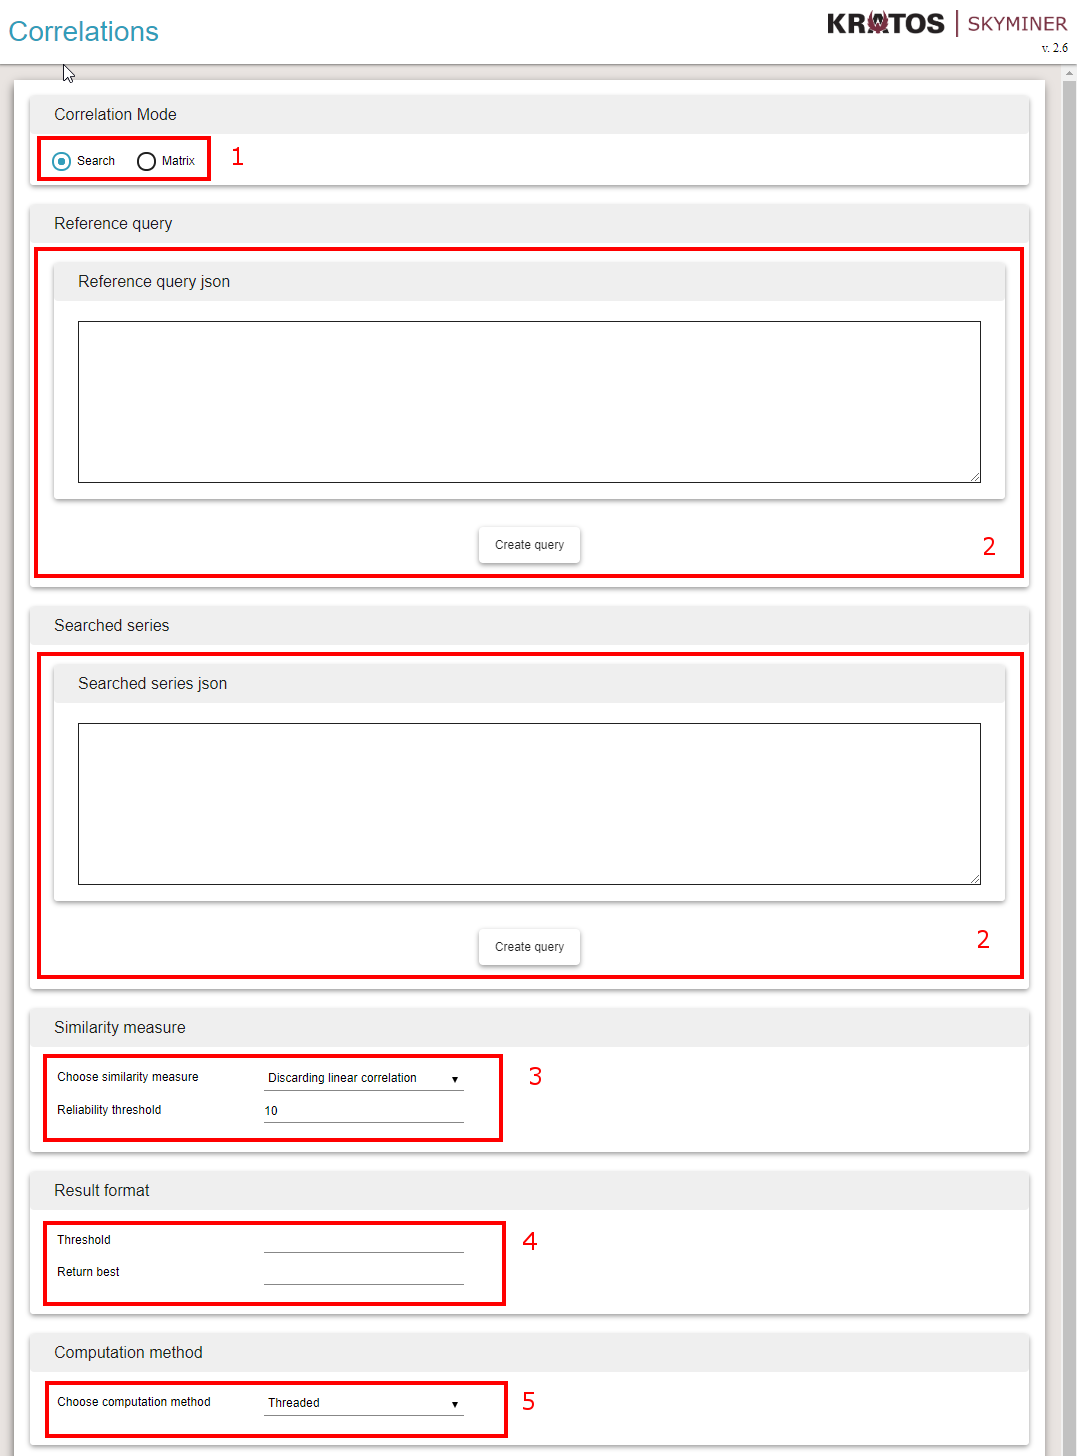
Choose Correlations Mode (1)
Search Mode takes one reference series and computes its correlations against all the other series specified: one Vs many correlations.
Matrix Mode takes only one set of series and computes correlation between each pairs: many Vs many correlations
Specify series used for correlations as skyminer queries (2)
It takes a Skyminer query in Json format. If correlation mode is Search, the first query shall return one single series of data points.
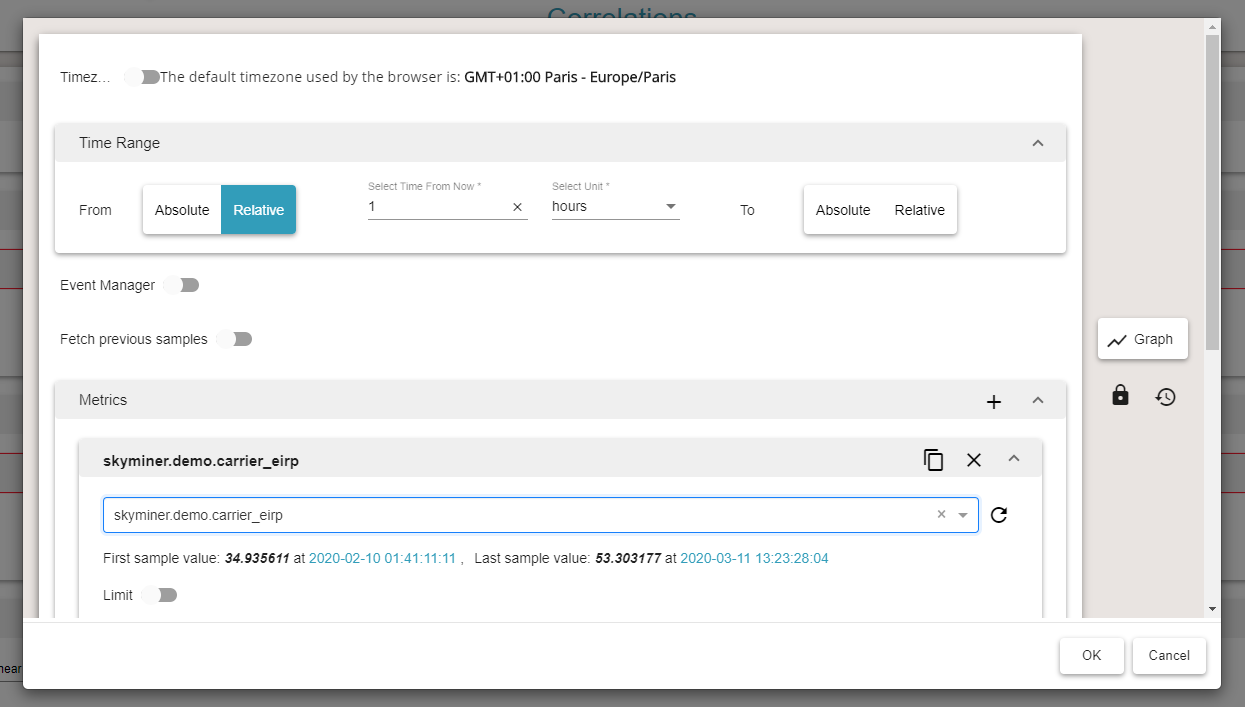
Clicking on Create Query button opens a query builder that helps generating a valid query.
Select similarity measure (3)
Similarity measure is the correlation measure to be used to compute the similarity between pairs of series. It defines the mathematical method that compares the behaviors of the series. The value returned by a similarity measure is between 0 and 1, 0 meaning that they have nothing in common and 1 that the measured behavior is exactly the same for the two series.
Implemented measures:
Discarding linear correlation: This correlation method is often called linear or Pearson correlation. It compares the relative variations of the time series, but is only using pairs of data points that have exactly equal timestamps.
DTW: Dynamic Time Warping is a method that originates from Speech Processing and that compares pairs of samples but allowing a flexibility of sample comparisons in a given time range (defined by the parameter called Maximum delay).
For a more precise description of similarity measures please refer to Details on similarity measures.
Select properties of result format (4)
Result format specifies some properties of how data must be returned by the server. Its main role is to limit the amount of data processed by the browser because it can become huge on large sets of data.
Shared parameters are:
Threshold: filters results according to their value. Results that have correlation scores lower than this limit are discarded. Should be a number between 0 and 1
Return best: limits the maximum number of results according to this value. Should be a positive integer.
In Matrix mode you have extra parameters:
Return perfect scores: filters results that are equal to 1 exactly. It happens that these results need to be removed because they are generated by constant or equal series and do not represent valuable information.
Sparse: specifies whether cross-correlations that where filtered by Threshold, Return best, or even Return perfect scores should be returned to fill the matrix on the lines and columns of correlations that have the kept correlation scores.
Select computational method (5)
Computation method specifies to the server how it should compute the correlations. This focuses mainly on the way to distribute computations on the server. Default threaded versions should be preferred for obvious computational speed reasons.
Building a correlation query
This section presents step by step how to build a correlation query in both search and matrix mode.
Correlation search
Correlation search allows you to compare one series of your choice to a set of other series. The goal is to have a reference oriented view into the data and find series that have a similar behavior to your series of interest.
First activate Search mode and create a query with the series you want to use as reference by selecting Create Query under the Reference query field.
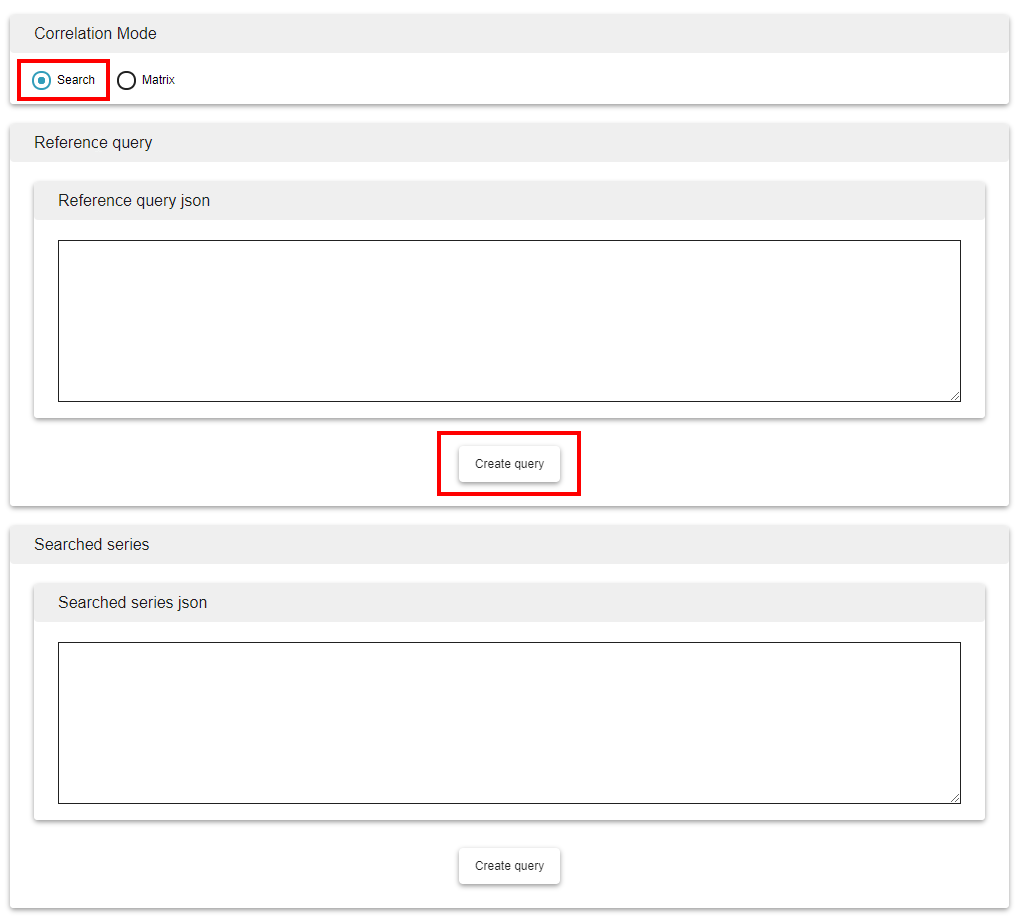
This will open the Skyminer query building interface. The query you build to serve as reference query must return a single series.
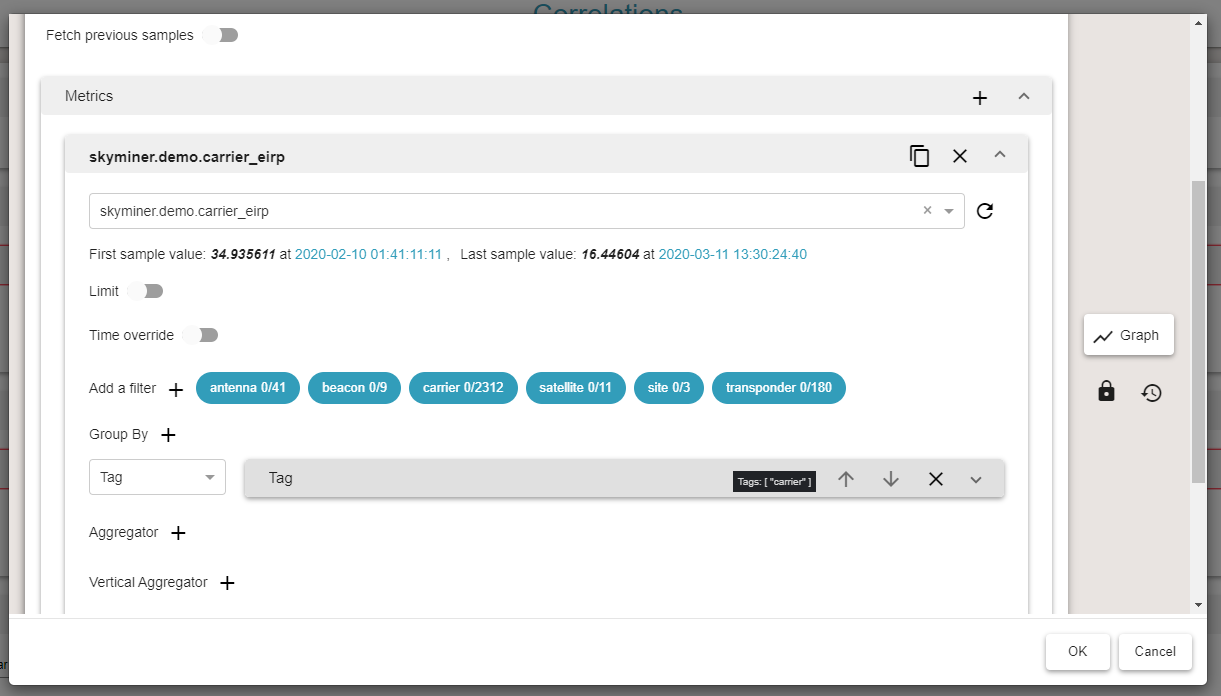
Do the same for Searched series but this time create a query that generates a set of series. You can do that by using the Group By feature and/or by querying multiple metrics.
You should then chose your similarity measure. If you know that your data is regularly sampled and synchronized between the series, you should probably use the Discarding linear correlation, which is often faster and less prone to false positives. Otherwise use DTW to compensate sampling irregularities and shifts. The Maximum delay option is the one that allows you to control what flexibility you want to give the algorithm on the time axis. For instance specifying it to 1 minute will allow the algorithm to proceed to time distortions and correlate sample that have timestamps that are up to 1 minute apart.
Note: Normalize, Beta and Local distance are advanced parameters of the DTW algorithm. You should use the default settings or consult the detailed documentation on similarity measures and their parameters in Details on similarity measures.
Both similarity measures have an option called Reliability threshold that can be interesting when you have irregularities in the sampling of your series. It specifies the minimum number of samples that need to be used in the correlation. If the requirement is not met the correlation score is set to 0 which allows you to easily discard this unreliable result.
Result format allows you to limit the number of results returned by the server. You will typically want to focus on the best hundred correlation results.
Finally you should specify the computation method. You should use the default threaded implementation which uses all the computational capacities of your server.
Once the query is built, you have two options:
You can launch the query and wait for the results to be displayed
You can generate a link that will allow you to execute the query by submitting that URL in your web browser at any time
When your results are displayed, you can save them and display them again at any time without having to re-execute the query. This is interesting for very deep queries that are long to execute.

Correlation Matrix
Creating a matrix query is very similar to a search query. Select the Matrix correlation mode.

The Reference series area disappears because the Matrix mode only requires a set of series and computes all pairs of correlations in this set. Create a query in the Searched series area. Make sure it is a query that generates multiple series. You can do that by using the Group By feature and/or by querying multiple metrics.
The similarity measures are identical to those used in Search mode.
Result format has two extra options that allow you to better control the amount of results.
When you choose to return the best n results in matrix mode, you get n correlation scores for n pairs of series (this might generate a matrix of size n x n or less). If you check the Sparse matrix option, only these results will be returned and the other entries of your matrix will be null. If you want to display the other correlation scores between the series involved in this best n correlations, you should uncheck this option
Return perfect score can be used to filter out results that are not useful in that they are too perfect (exactly equal to 1). For instance it happens that a set of measures is constantly equal to 0 because the measuring devices are not properly set. This would generate a set of highly correlated series that we might want to remove because they would hide other less obvious correlations.
The rest of the query works exactly the same as in the search mode.
Analyzing results
This section gives a few clues on how to analyze results generated by both the search and matrix mode.
Correlation search
When you execute your correlation search query, the results are returned in the form of a bar chart. The plot of the reference series is also displayed.
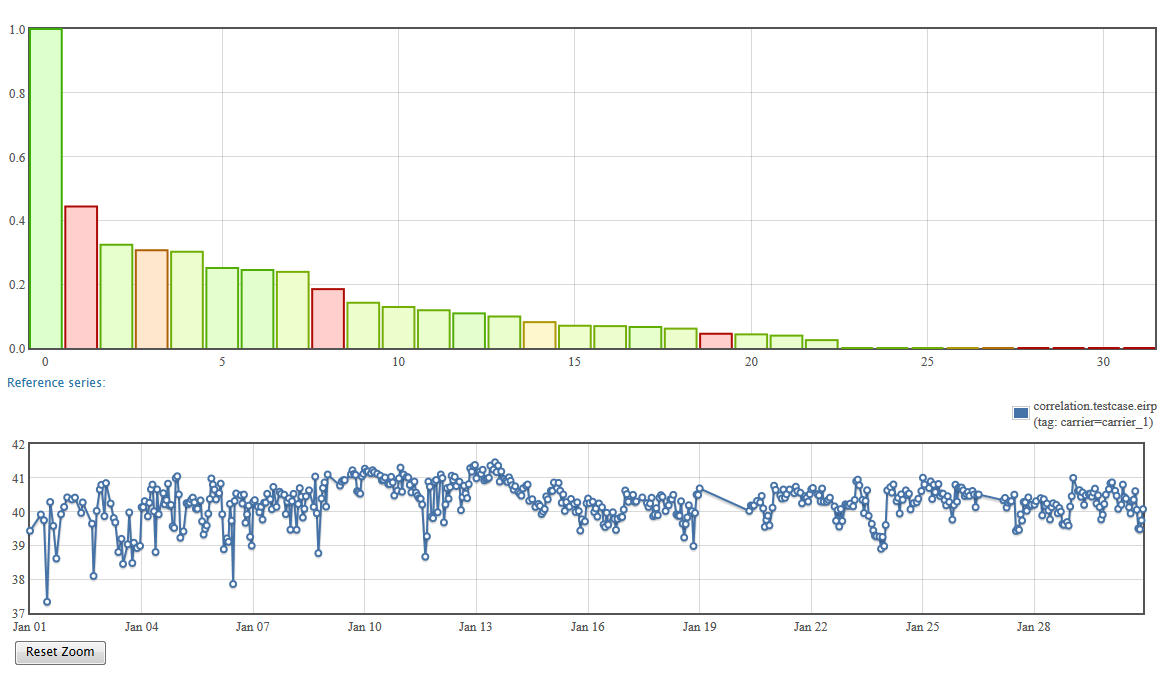
The bar chart represents the correlation scores sorted by strength. The height of the bar is the result of the similarity measure. Its color represents the reliability of this measure. If it has been established on a large number of samples, and thus it is reliable, it will be green. If the number of samples is lower, it is represented in orange or red.
To get more information on each correlations, you can pass your cursor on the bar chart to get a detailed tooltip.
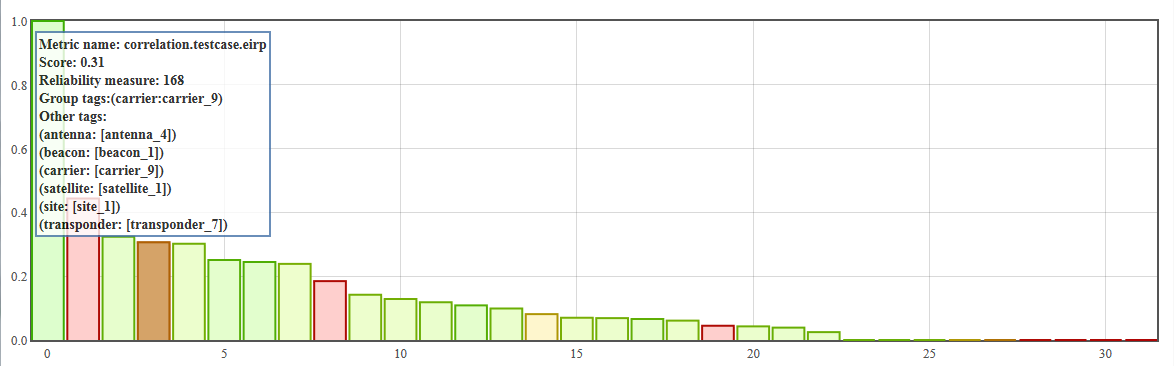
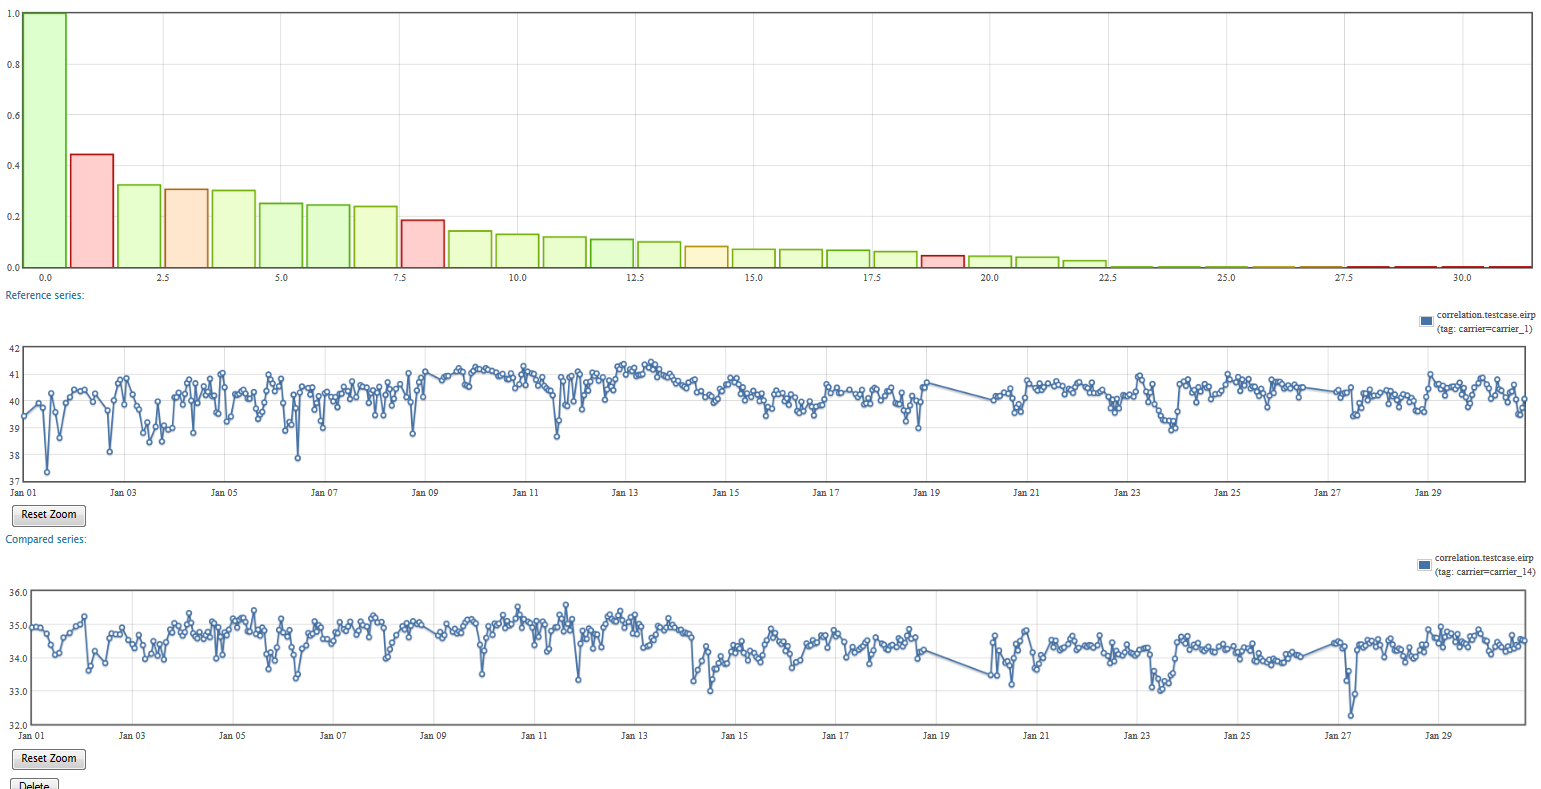
You can also click on a bar to query for the corresponding series. This allows you to visualize the raw data and better understand the correlation scores.
Correlation Matrix
The matrix mode generates a dynamic correlation matrix. A correlation matrix of n series is an n x n matrix that represents the correlation scores of all pairs of series. Each line or column represents the correlation scores of one series against all the others. The matrix is symmetric because a correlation is commutative, and the scores on the diagonal are always equal to 1 as they represents the correlation of series with themselves.
The more intense a color, the greater its correlation score. As for the bar chart in correlation search mode, green indicates that the correlation is reliable, and orange or red signify the correlation has been done on less samples.
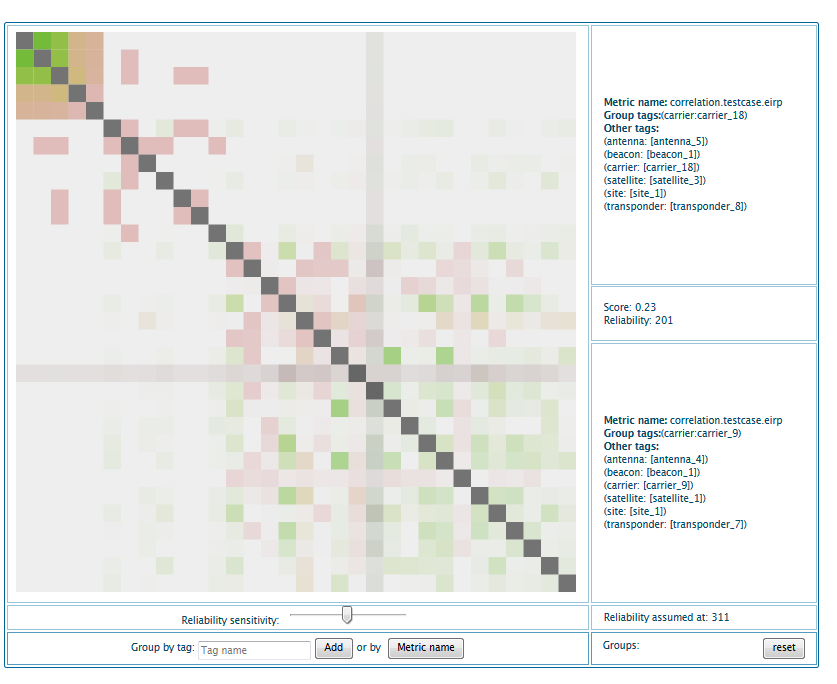
On the right of the matrix, the pane describe the cell your cursor is currently hovering. It provides you information on both series involved in the correlation and the score itself, along with its reliability.
Under the matrix you have a slider that allows you to tune the coloring relative to the reliability. The reliability threshold at which the cell starts to turn into green is indicated on the right of the slider.
The last two cells of the table are used to change the clustering of the matrix. It allow you to re-organize the cells by a given tag name or by metric name. You can chain multiple groupings by adding multiple elements consecutively
Note: you should avoid representing matrices that are larger than 200 x 200 because it can generate significant slowdowns of you browser.