Creating a new graph
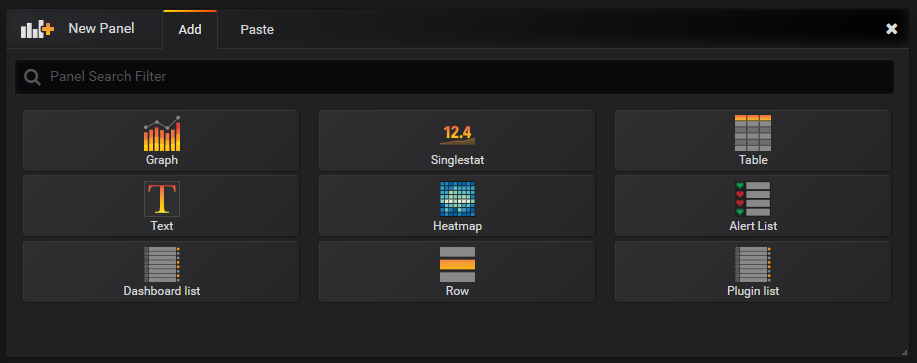
To create a new graph, go to the row menu (described in section above) and click on the corresponding button (1). This action will automatically create a new empty panel in your dashboard. You will have to choose the graph type you want to add (see image below).
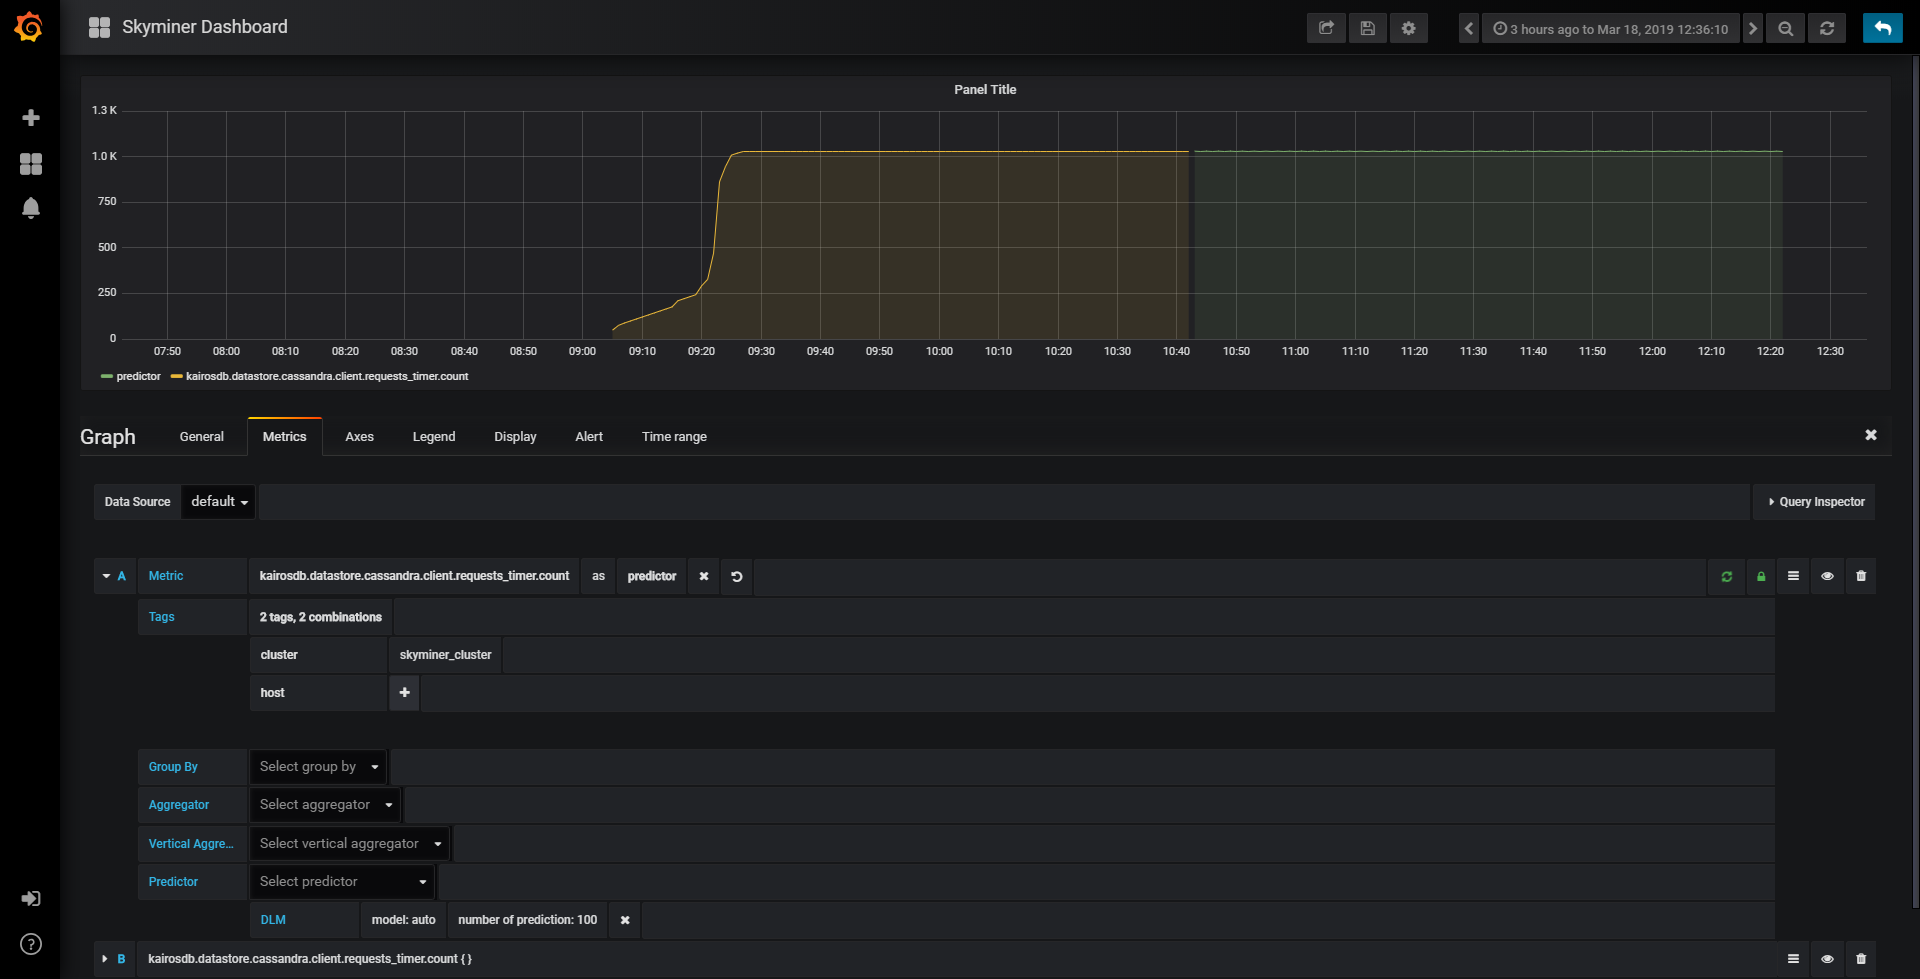
At this point you have an empty graph. You can edit its content by clicking on its title then on Edit. This will open the query editing view.
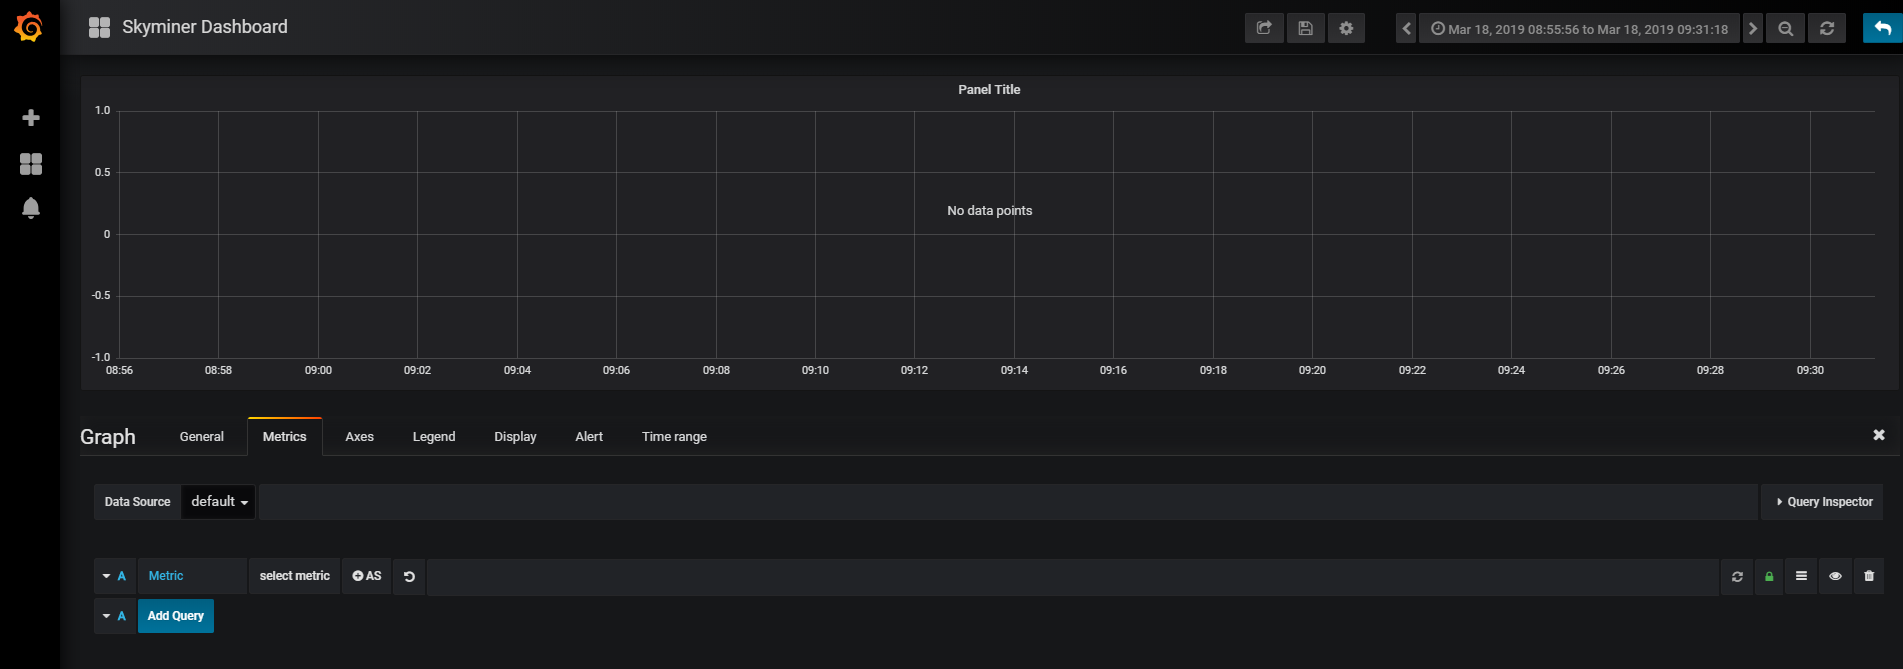
This view allows you to build a simple request in 2 clicks, you just have to select a metric from an auto-complete dropdown list of metrics.
note: If you want to visualize data from this view, you should click on auto refresh button (framed in red on the screenshot below).
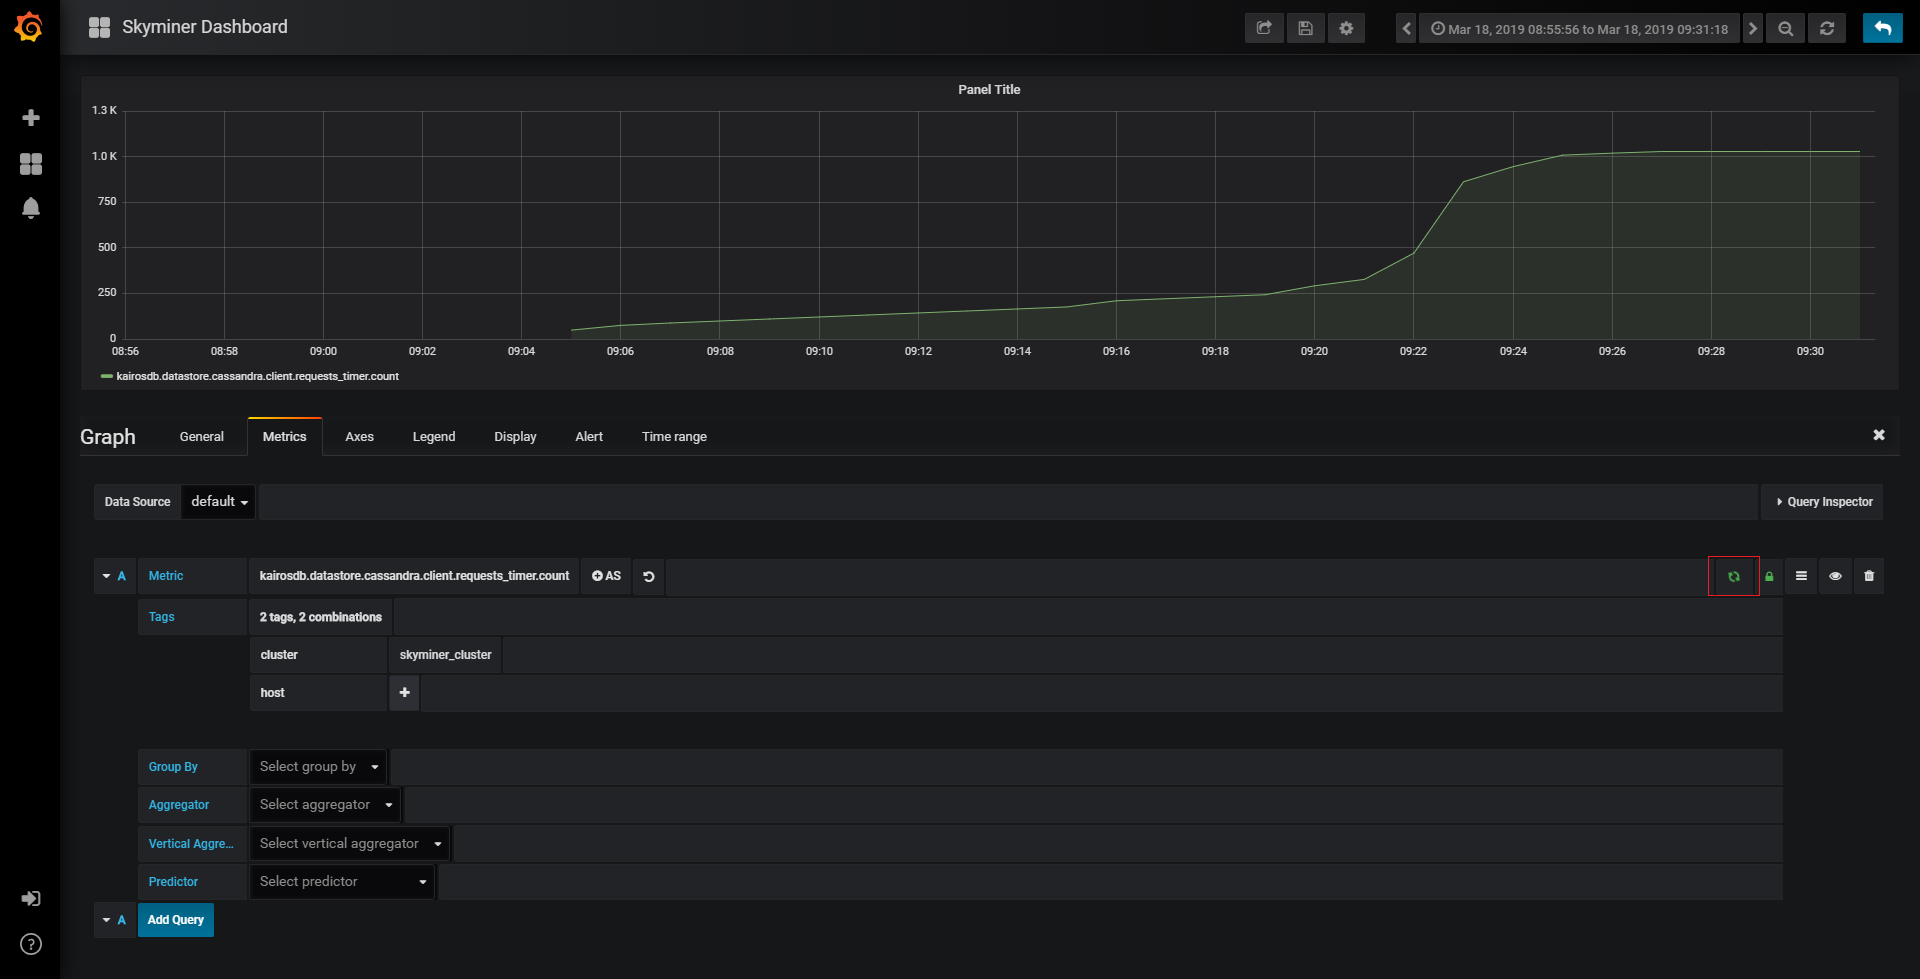
You can then customize your graph with Skyminer features (add tags, group your data, add aggregators …). With the auto refresh, all changes will automatically be displayed.
Once you are satisfied with your request, you can go back to the dashboard panel with the Back to dashboard button in the menu bar on the top.
Graphs can be customized in various ways and made very functional and aesthetic: colors, format (dots, lines, bars, specific styles, stacked charts, step charts)
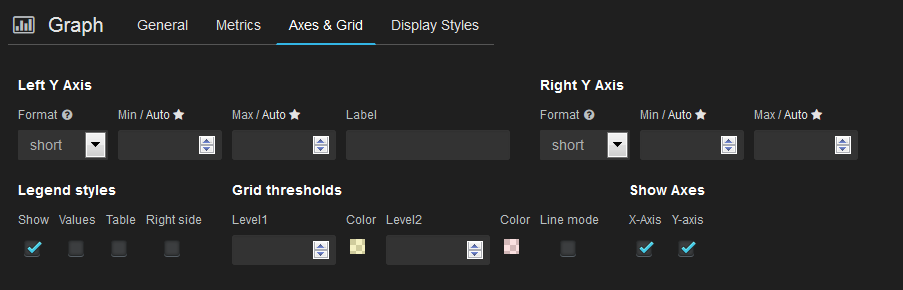
Creating a singlestat
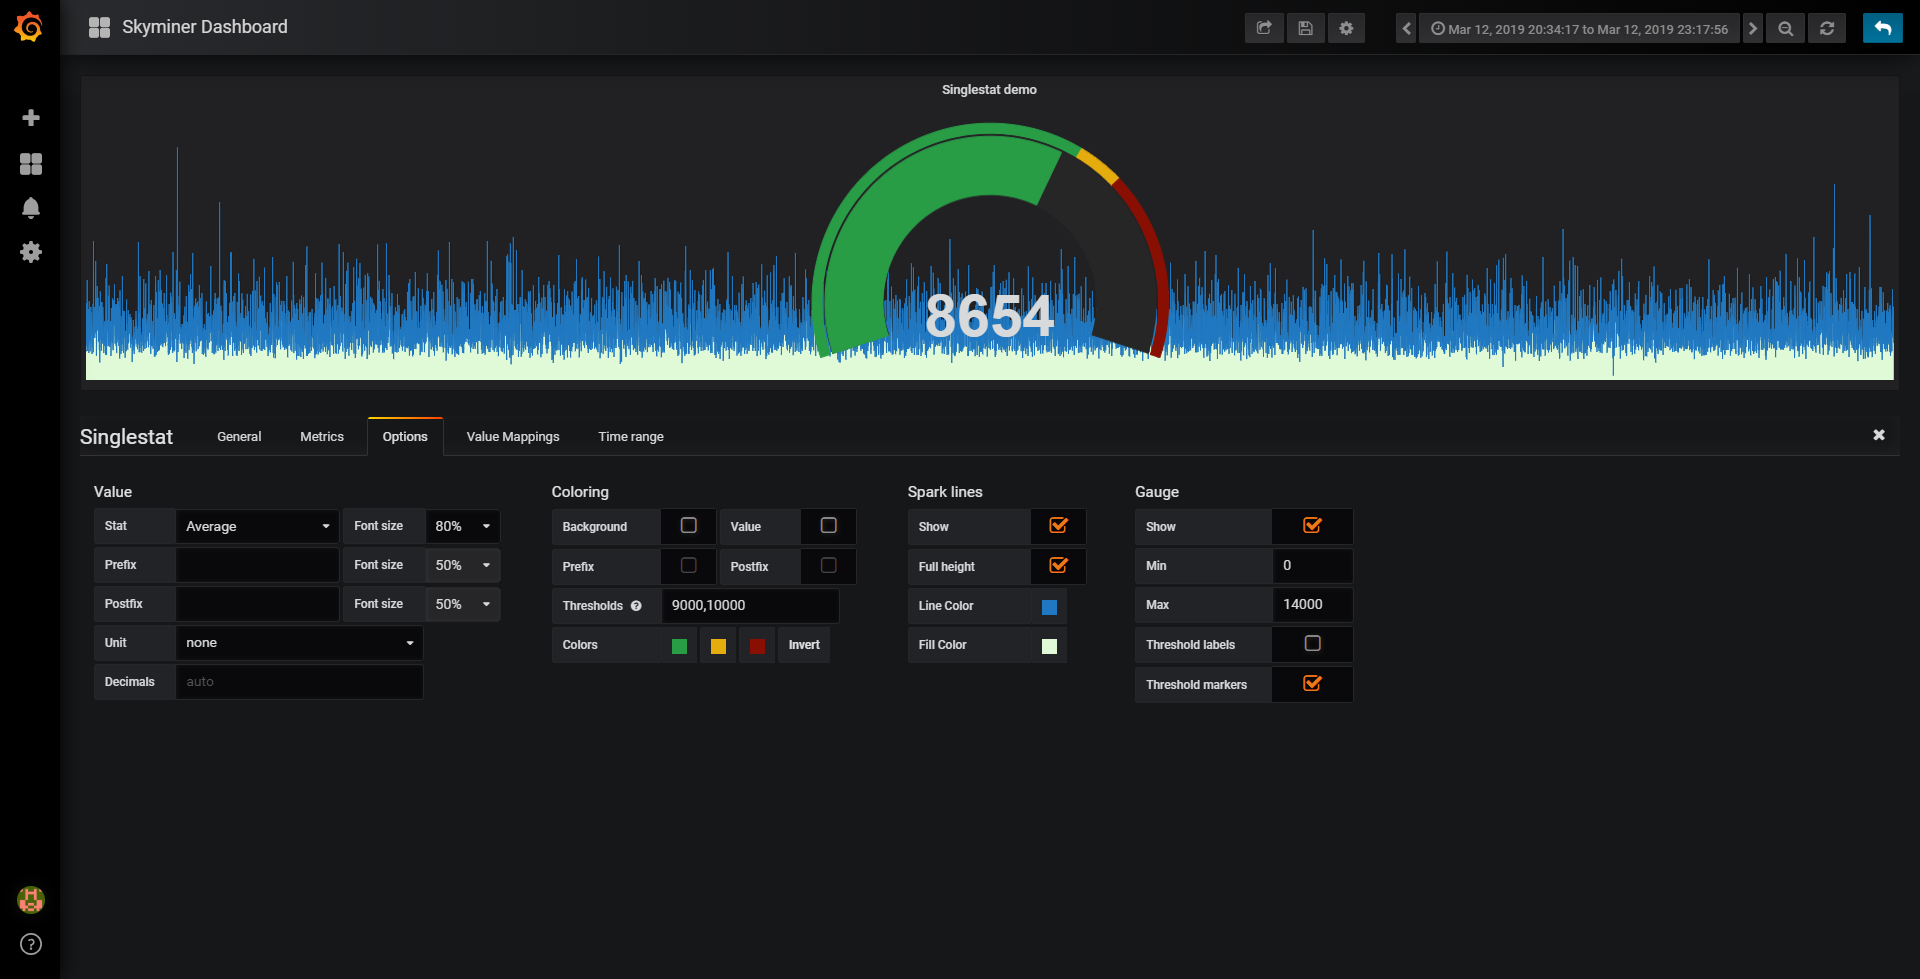
A singlestat is a panel that displays the latest value of a series of interest, with a customizable color according to that value. It can be used to generate simple indicators for critical values. Creating a singlestat is exactly the same than Creating a new graph. To configure and customize your singlestat, go to the Options tab when you are in editing mode.
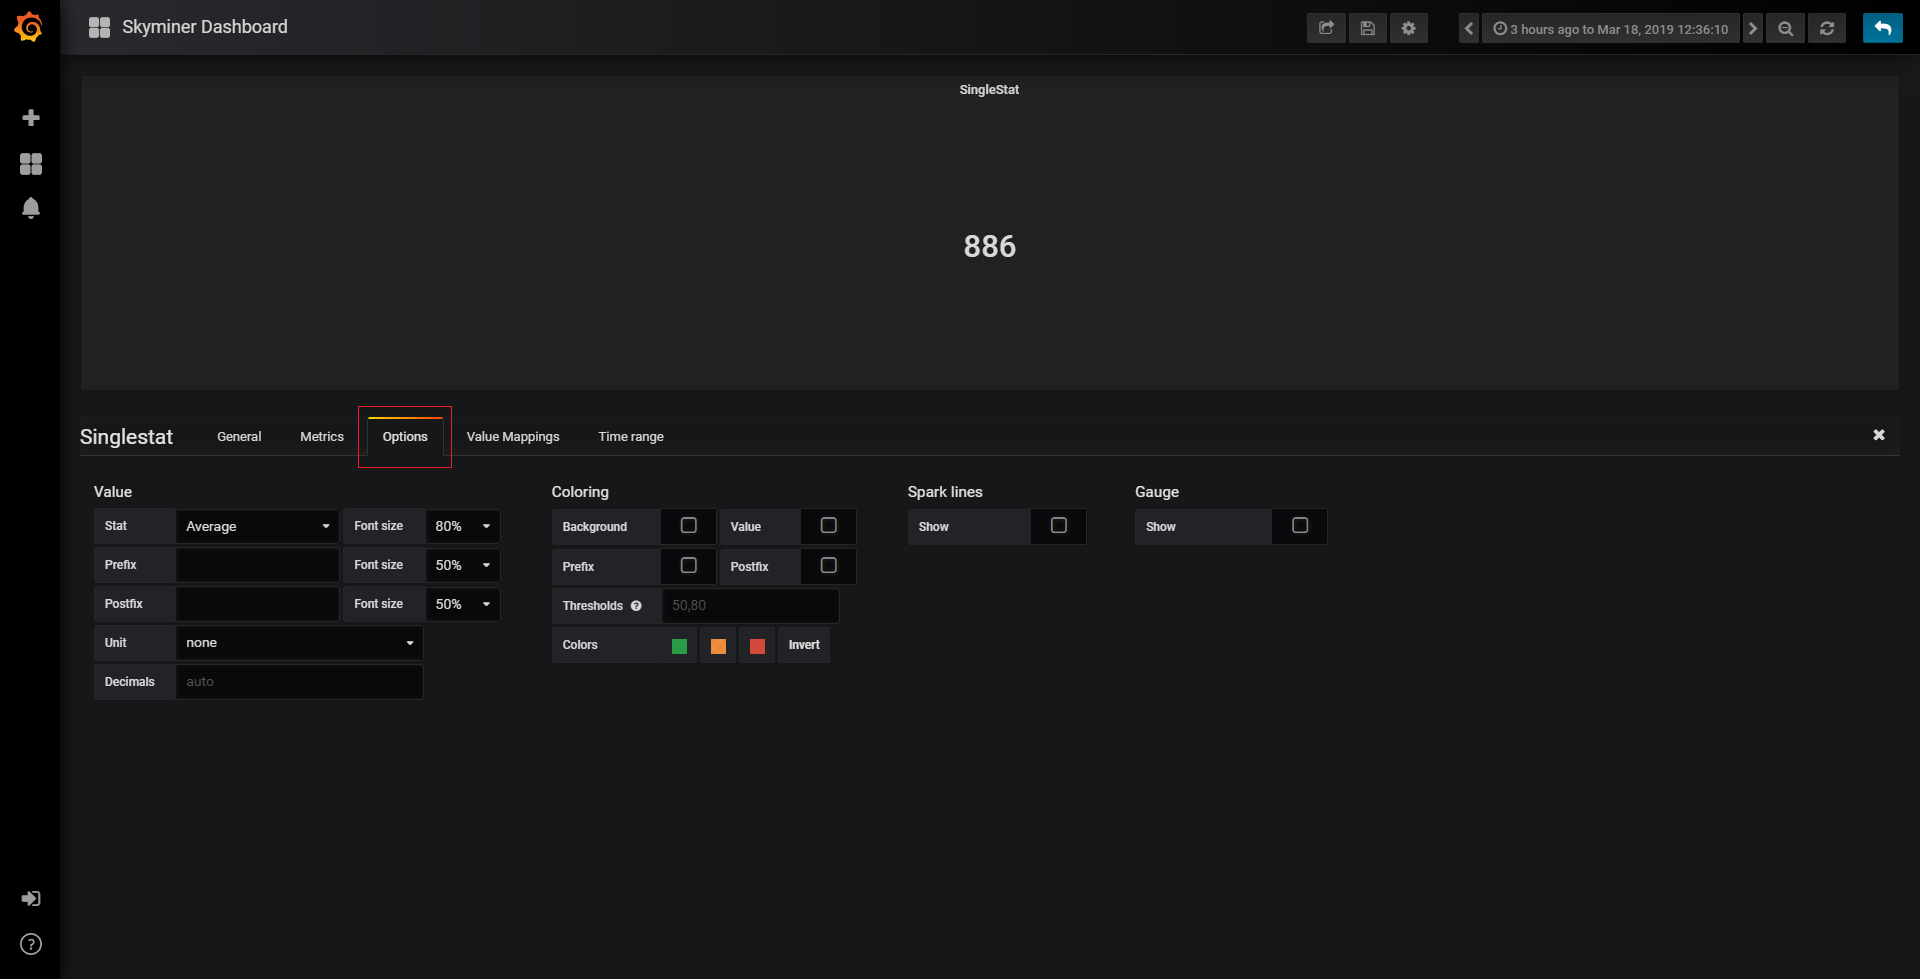
There are multiple options and many possible combinations. You can configure the colors of your singlestat, define thresholds, stack a chart, and add a gauge:
Fetch previous sample
Unlike all other Skyminer features, “Fetch previous sample” is global to all metrics defined in the dashboard panel. When activated, it will fetch the last known sample value and place it at the beginning of the dashboard.
Different options can be used:
Merge groups: activated by default, all groups are merged into one.
Time align: activated by default, the last known sample timestamp is aligned with the start of the time range. The original timestamp of the sample is preserved if this option deactivated.
For empty results only: deactivated by default, it will fetch the last known sample only for the metrics that should return an empty result (no sample for the given time range).
Predictions
Skyminer predictions can be accessed from the dashboard, provided that the end time for the dashboard is set in the future. In the time range selection menu, choose Custom and set the ending date to a time slightly after the time at which you expect the prediction to end.
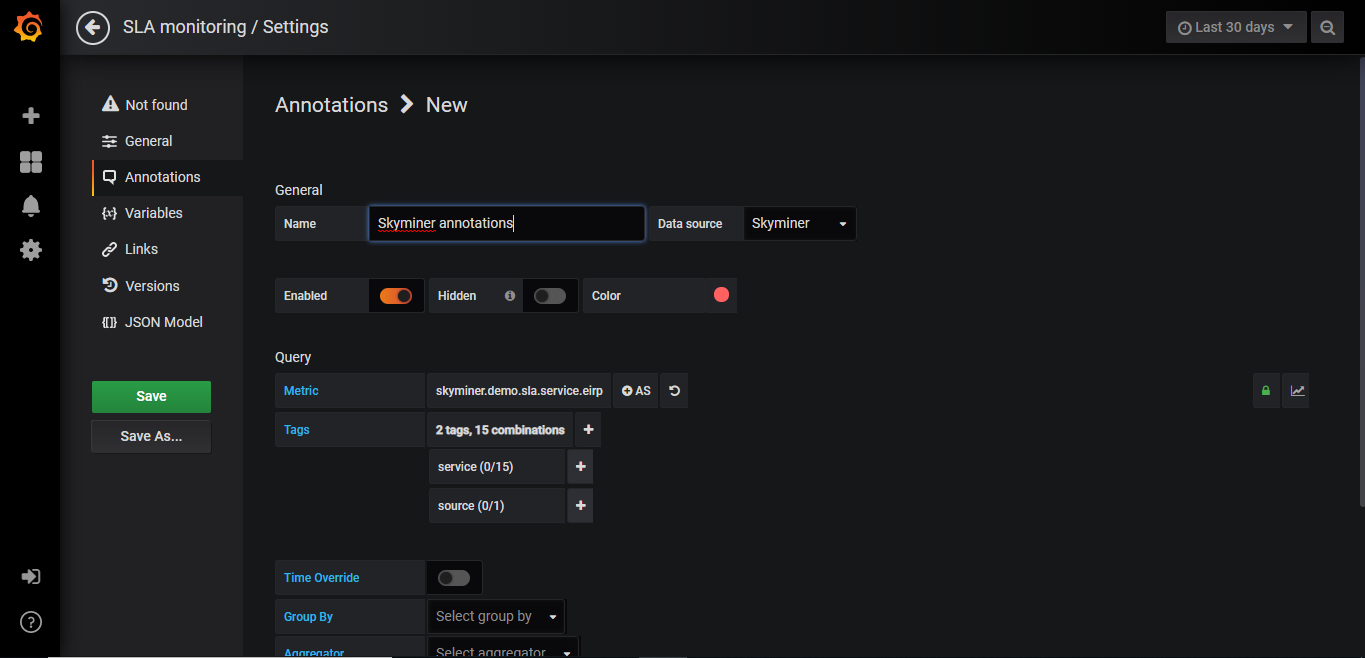
Skyminer annotations query
Skyminer is able to display annotations using Skyminer queries. To do so, create a new annotations query and select the Skyminer datasource instead of the Grafana one. The query editor is the same than the metric query one.
Please refer to the Grafana official documentation.
Templated queries
Grafana allows the user to use template variables for dashboards. You can access this option in the dashboard settings.
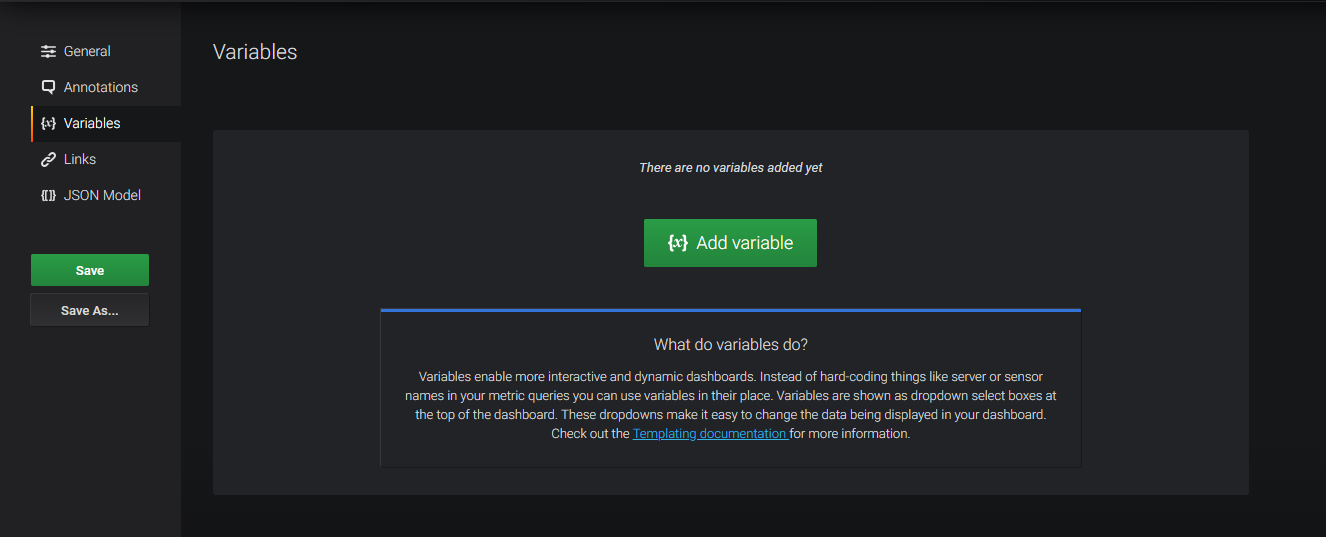
Configure a variable
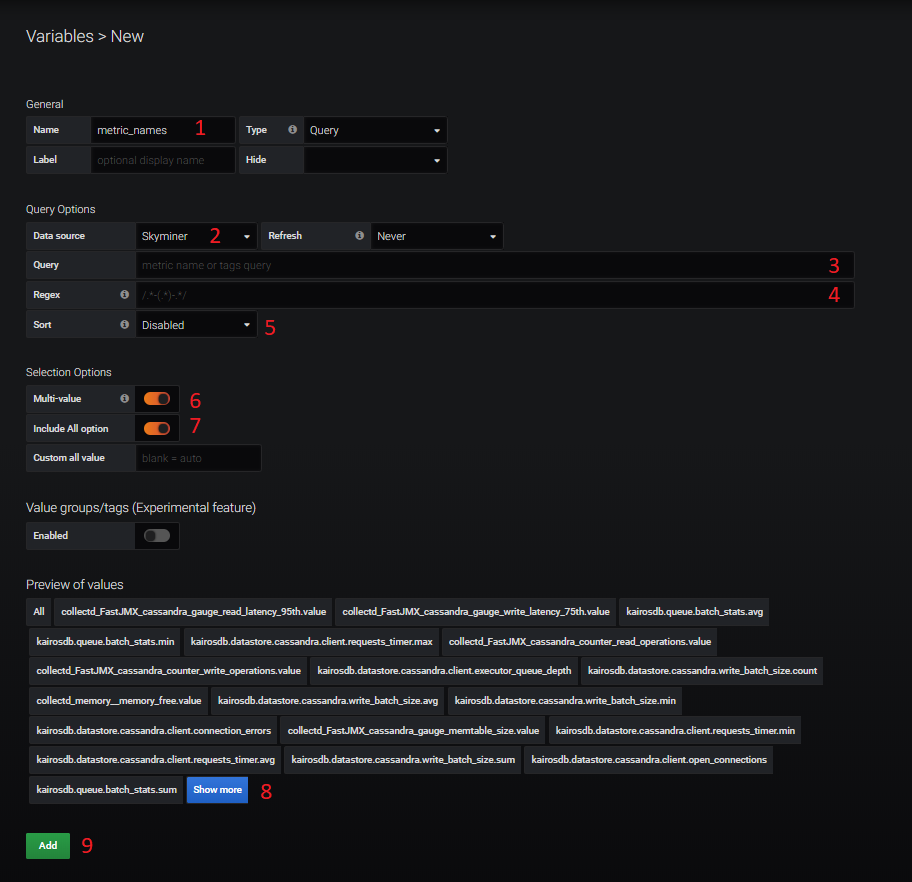
Name of the variable
The data source where data are pulled, in this case you will always choose Skyminer
Query, defines what data you want from the data source (please see Query syntax for more information)
Regex, you can apply a regex on the results from the query in order to filter values
Sort, this feature allows you to sort values
Multi-value, this option allows you to pick multiple value from the list of values
Include all option, add a value in the list of values that allows you to select all values in one click
Preview of values, show values received from the data source with the query you defined
Add, don’t forget to add the variable and save it
Query syntax
A syntax for the query part of this feature has been defined. You must use it to operate this feature. This syntax is really close to JSON.
"metric":"metric_name", "tagKey": "tag_name", "tagName": ["tagValues"], "tagName2": ["tagValues2"] ...
Note: This syntax is case sensitive, be careful with capitalization
Examples
Empty request: getting all metric names
An empty query means you want to get all metric names from the data source.
Getting all tags name for a metric
If you want to get all tags name for a given metric you need to use this syntax:
"metric":"foo"
Getting tag values
In order to get all values for a given metric and tag name you need to use this syntax:
"metric":"foo", "tagKey": "the_tag_you_want"
Getting tag values filter by another tag value
If you want to get all values for a given metric and tag name with a filter (associating tag) you need to use this syntax:
"metric":"foo", "tagKey": "bar", "status":["success"]
This query will return all values of bar for the metric foo that also match with the tag status with value success. Remember a metric has a lot of combinations of tags.
For example bar is an array of value [‘a’, ‘b’, ‘c’] that is respectively in combination with status: [‘failed’, ‘success’, ‘success’]
The query above will return ‘b’ and ‘c’ as values, ‘a’ does not match with the filer.
Note that you can chain several filters.
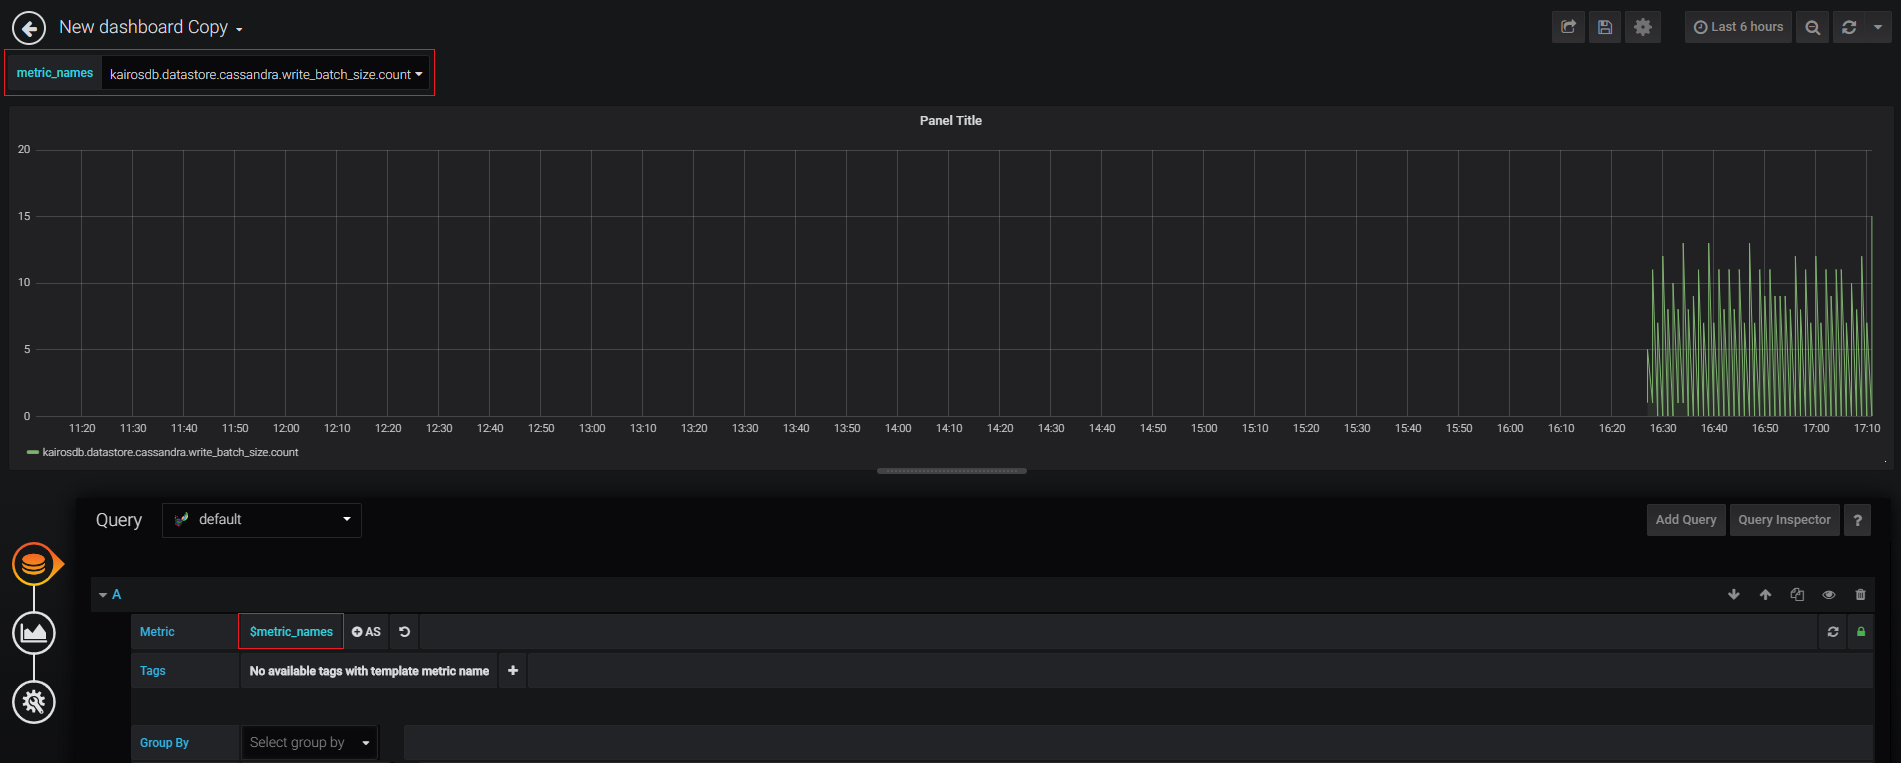
Dashboard with template variables
New fields appears on the top the dashboard page when template variables are defined. You can apply these variables to different fields of the query (all input text) and more especially on metric names and tags. When you change the value of the template variable the dashboard automatically refresh itself.