Home page
When you install Grafana with Skyminer, the data source is already set by default. A default dashboard name ‘Home’ is created which allows you to quickly navigate between your saved dashboards.
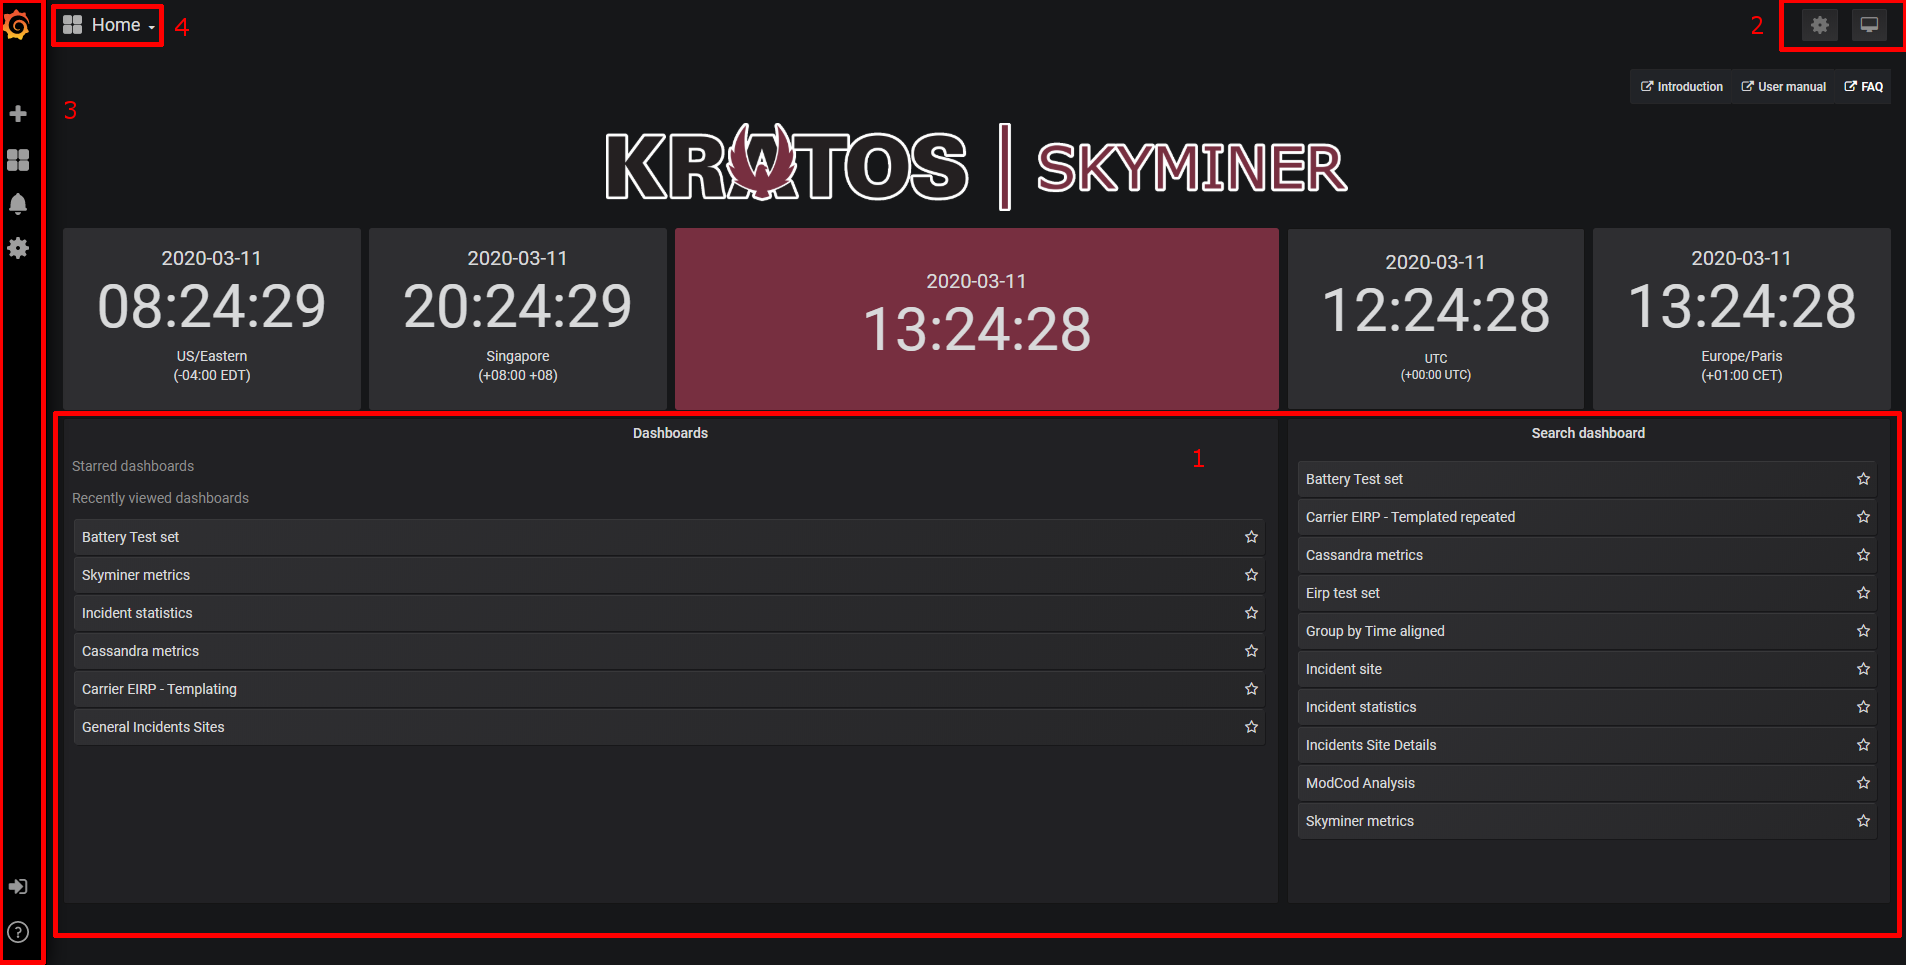
1 - This section provides you a link to dashboards marked as favorite, recently viewed, and example dashboards.
2 - Settings and Cycle view mode
3 - Grafana Menu.
4 - Dashboards panel.
Grafana Menu
This item is displayed on all pages of Grafana. You can hide or show it by clicking on the Grafana logo.
Note: Skyminer does not support alerting, so the alert menu is unusable.
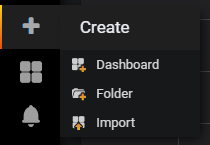
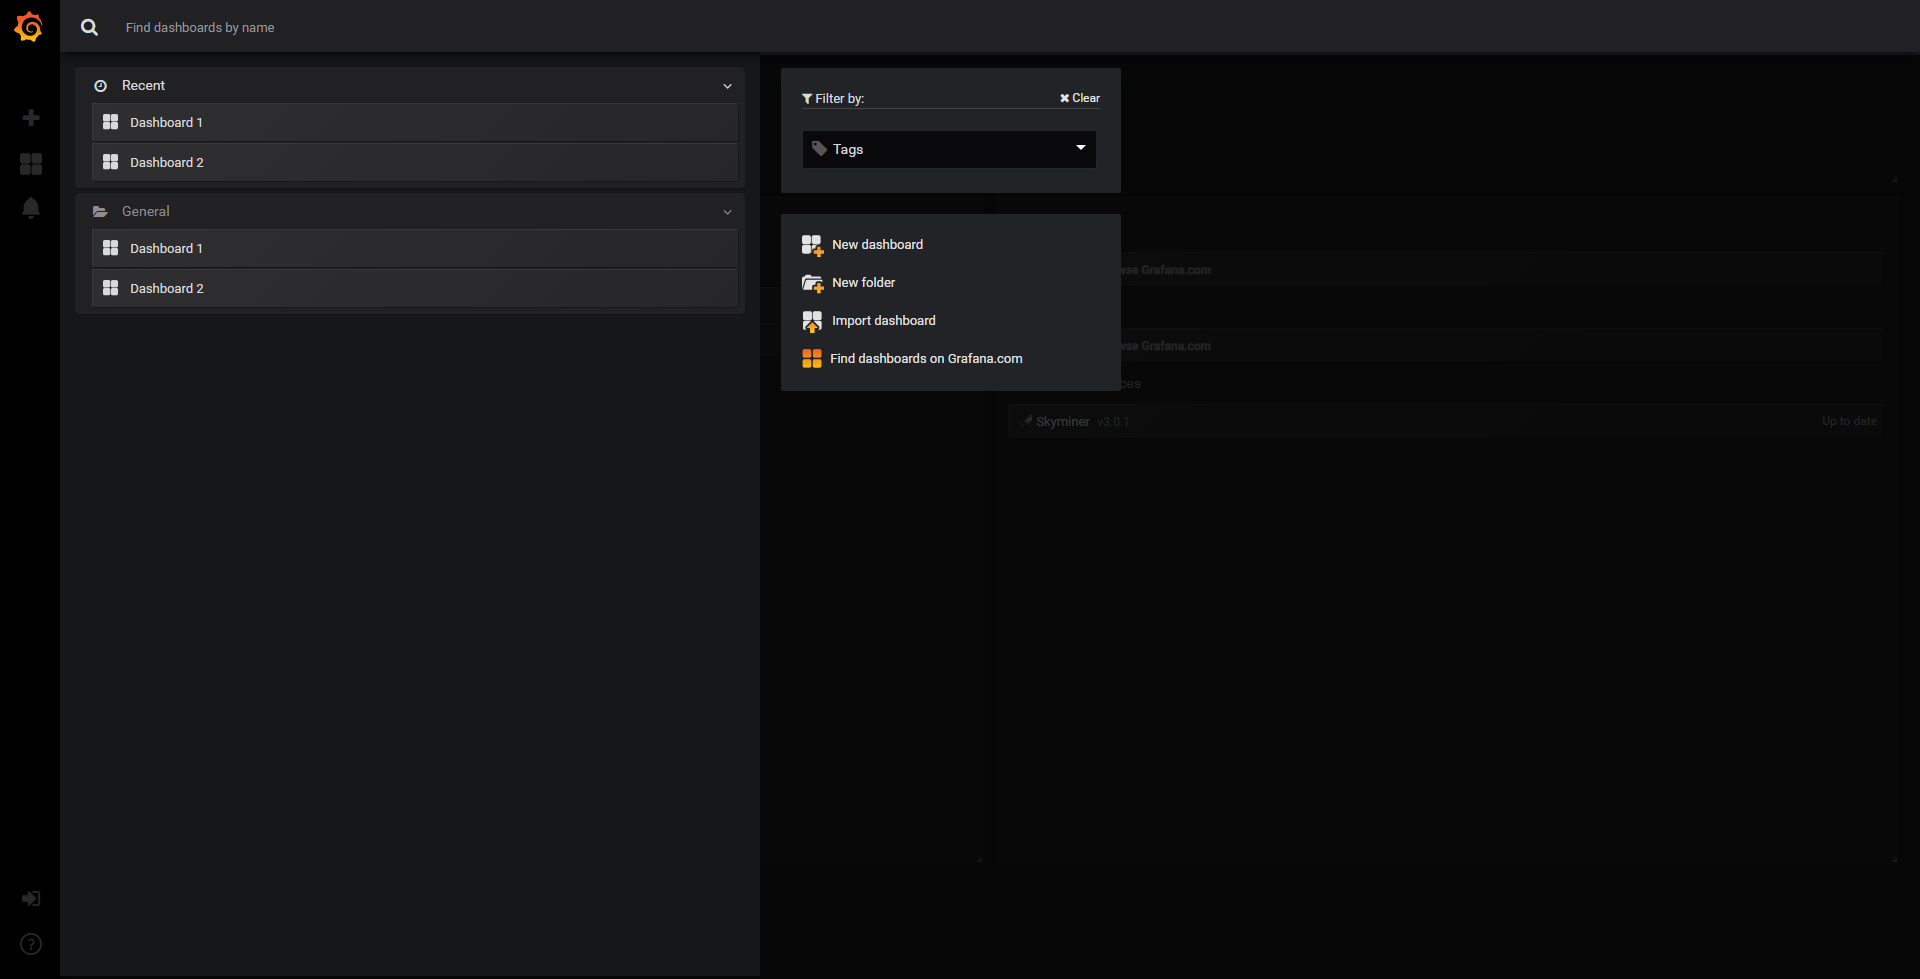
Create menu item
From this menu item you can create a new dashboard or folder or import an existing dashboard.
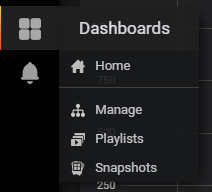
Dashboards menu item
From this menu item you can navigate to the Home dashboard and manage your dashboards, playlists and snapshots.
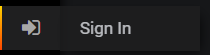
Sign In / Sign Out
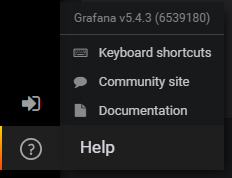
Help
Dashboards panel
This panel allows you to navigate through dashboards. You can filter them by name or by tags with the search field.
Dashboards are organised by folders.
When you click on a dashboard name you are redirected on the Dashboard page.
Dashboard page
A dashboard, on Grafana, is made up of different rows and panels that will format the data.
Each panel can be edited, deleted and re-arranged by clicking and dragging.
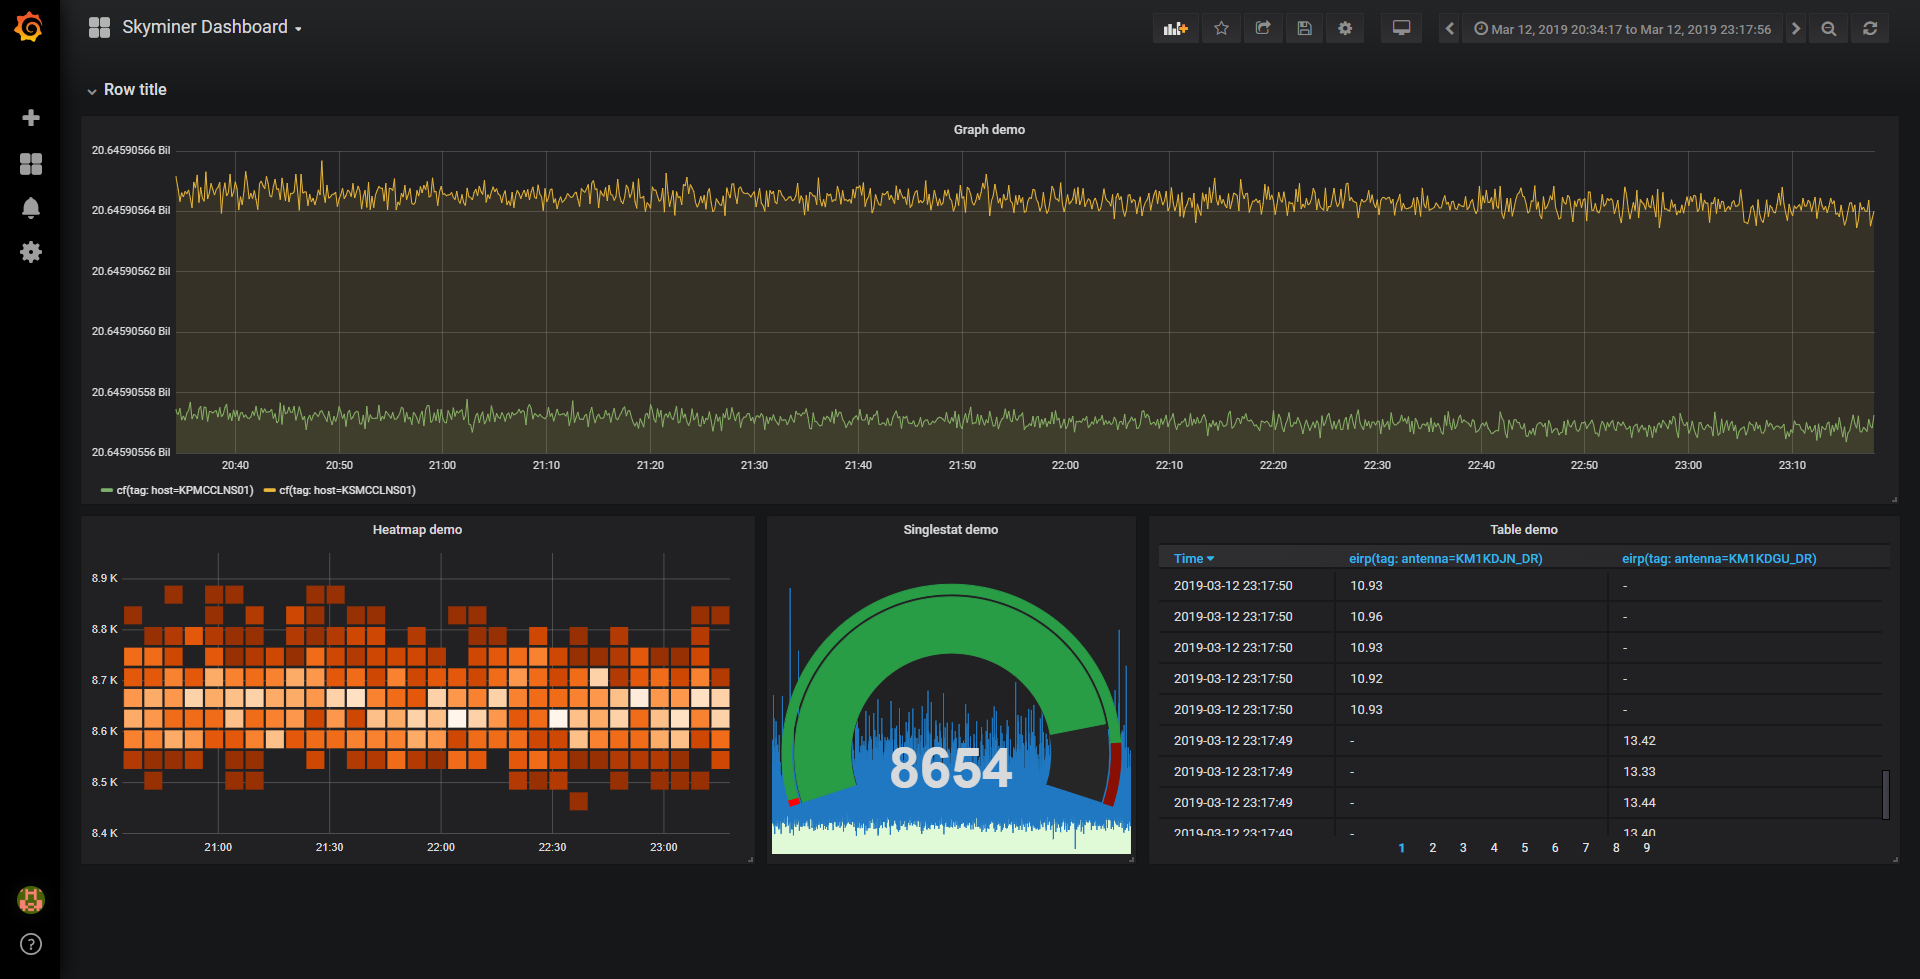
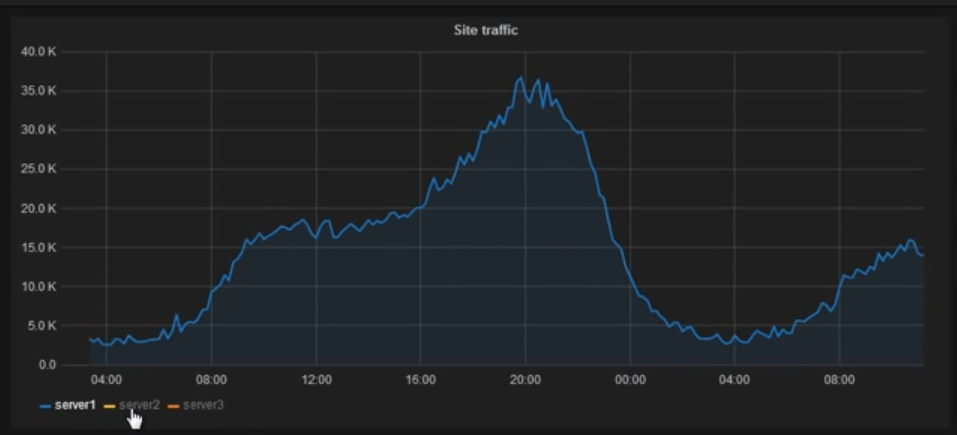
Graphs can be interactively filtered by selecting/unselecting the individual series.
Menu

Add panel, this button allows you to add a new panel to your dashboard
Share dashboard, this button allows you to share your dashboard using a link or a snapshot, or by exporting it (into a JSON file for example)
Save dashboard
Settings, you can change the theme, time settings or even hide controls for when the dashboard is used in production
Cycle view mode
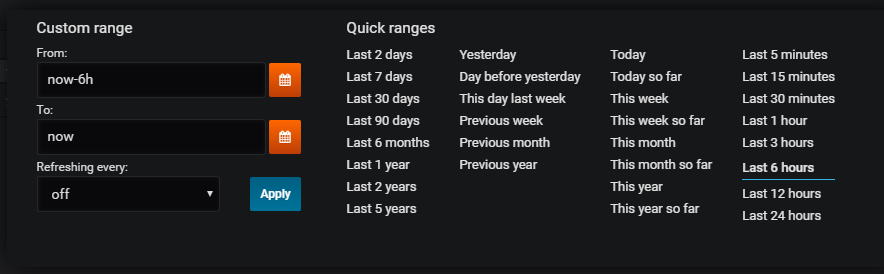
Time range controls for your entire dashboard. This is where you set the start and stop time of your time series, but also the refresh rate of the dashboard by setting Refreshing every option
Zoom, graphs are zoomable but note that it will modify the time range of the entire dashboard
Refresh the dashboard (on demand)