Aggregators
Overview
Aggregators perform operations on data points, like downsampling. For example, you could sum all data points that exist in 5 minute periods.
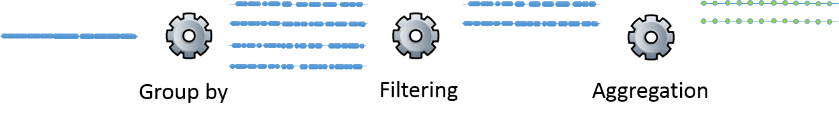
Aggregators can be combined together. For example, you could sum all data points in 5 minute periods then average them for a week period.
Aggregators are processed in the order specified in the query. The output of one is sent to the input of the next.
If no aggregator is specified, then all datapoints that match the tag filtering are returned.
Description
There are many different aggregators available in Skyminer.
Note: The default aggregator option selected in the UI is Average
The downsampling aggregators
Downsampling allows you to reduce the sampling rate of the data points and aggregate these values over a longer period of time. For example, you could average all daily values over the last week. Rather than getting 7 values you would get one value which is the average for the week.
Avg - returns the average value
Std - returns the standard deviation
Percentile - Calculates a probability distribution and returns the specified percentile for the distribution. The “percentile” value is defined as 0 < percentile <= 1 where .5 is 50% and 1 is 100%
Least squares - returns two points for the range which represent the best fit line through the set of points.
Max - returns the largest value
Min - returns the smallest value
Minmax - returns both min and max
Sum - returns the sum of all values
First - returns the first sample in each range
Last - returns the last sample in each range
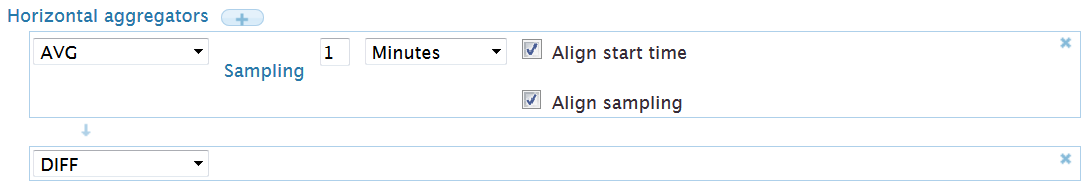
One very important notion with downsampling aggregators is alignment. There are two boolean parameters to downsampling aggregators that help set the alignment:
Align sampling: forces the sampling ranges to be aligned based on the sampling size. For example if your sample size is either milliseconds, seconds, minutes or hours then the start of the range will always be at the top of the hour. The effect of setting this to true is that your data will take the same shape when graphed as you refresh the data.
Align start time: the aggregated point for each sampling range is aligned to the start of the range.
Other aggregators
Some aggregators offer other kinds of processing without reducing the number of datapoints.
Rate: ratio between the difference in value and timestamp of two successive datapoints. Takes a unit parameter that tells how to calculate the ratio (ie rate in seconds, milliseconds, minutes, etc…).
Div: takes a “divisor” which is the value that all data points will be divided by.
Scale: same as div but with a multiplying factor.
Sampler: computes the sampling rate of change for the data points.
Diff: computes the difference between successive data points.
Gaps: marks gaps in data according to sampling rate with a null data point.
Interpolation: generates a regular sampling at the specified rate using linear interpolation.
Alias: changes the metric name. Any name is possible.
Tag: adds a tag to all the datapoints returnes by the query. If the tag already exists, it adds the new value to the list of values for that tag.
Untag: if neither tag name nor value is specified, removes all tags. If tag name is specified but not the value, removes that tag. If both the name and value are specified, removes the specified value only.
Time align: shifts timestamps so the start of the time override matches the start of the reference time, that is to say the start time for the whole query. If align_to_end is true the end time of the time override will match the end of the reference time instead. Reference start or stop time can be overridden if one does not want the time of the query to be used.
Time shift: shifts the timestamp of the specified amout of millisecond. Use a negative integer to shift backward.
Limit: throws an exception of the specified number of datapoints is overstepped. This is very useful to avoid building excessively long queries.
Normalize: Returns the normalized data using the Z-normalization algorithm. The resulting data will be scaled and centered around the series standard deviation in order to have a mean value close to zero.” + A Minimum of two points are necessary to compute the normalization, and this aggregator will throw an exception otherwise
Javascript aggregators
JavaScript aggregators allow the user to create custom aggregators without modifying the client. You can either write an entire script that terminates with a return statement, or simply provide a single lined script.
There are four sorts of JS aggregators:
JS Filter: allows to filter values according to a scripted statement. For instance the simple script “value!=0” will filter out every values that are different to 0. Current value is accessed through the value variable and current timestamp through timestamp.
JS Function: transforms every value according to a given function. For instance “value*2” will multiply every value by 2. Current value is accessed through the value variable and current timestamp through timestamp.
JS Range: allows to create downsampling aggregators. For instance to recreate the sum aggregator one would write:
var sum = 0;
while(values.hasNext()) {
    var dp= values.next();
    sum+=dp.getDoubleValue();
}
return sum;
The variable values allows you to access to an iterator over the datapoints within the sub range. Use hasNext() and next() to iterate over the datapoints. Use getTimestamp() to access the timestamp of the datapoint and getDoubleValue() to access its value.
JS Regression: is a particular type of range aggregation. It allows to access to the SimpleRegression library from the Apache Commons Math 3 library. You access the regression object with the variable named regression. You can then call functions such as regression.getSlope() or regression.getRSquare(). The following script returns the ratio between the regression sum squares and the error sum squares under some thresholding condition:
if (regression.getN() <100 || regression.getSumSquaredErrors() == 0)
    return 0;
return regression.getRegressionSumSquares() / regression.getSumSquaredErrors()
Access to Aggregator documentation in Skyminer UI
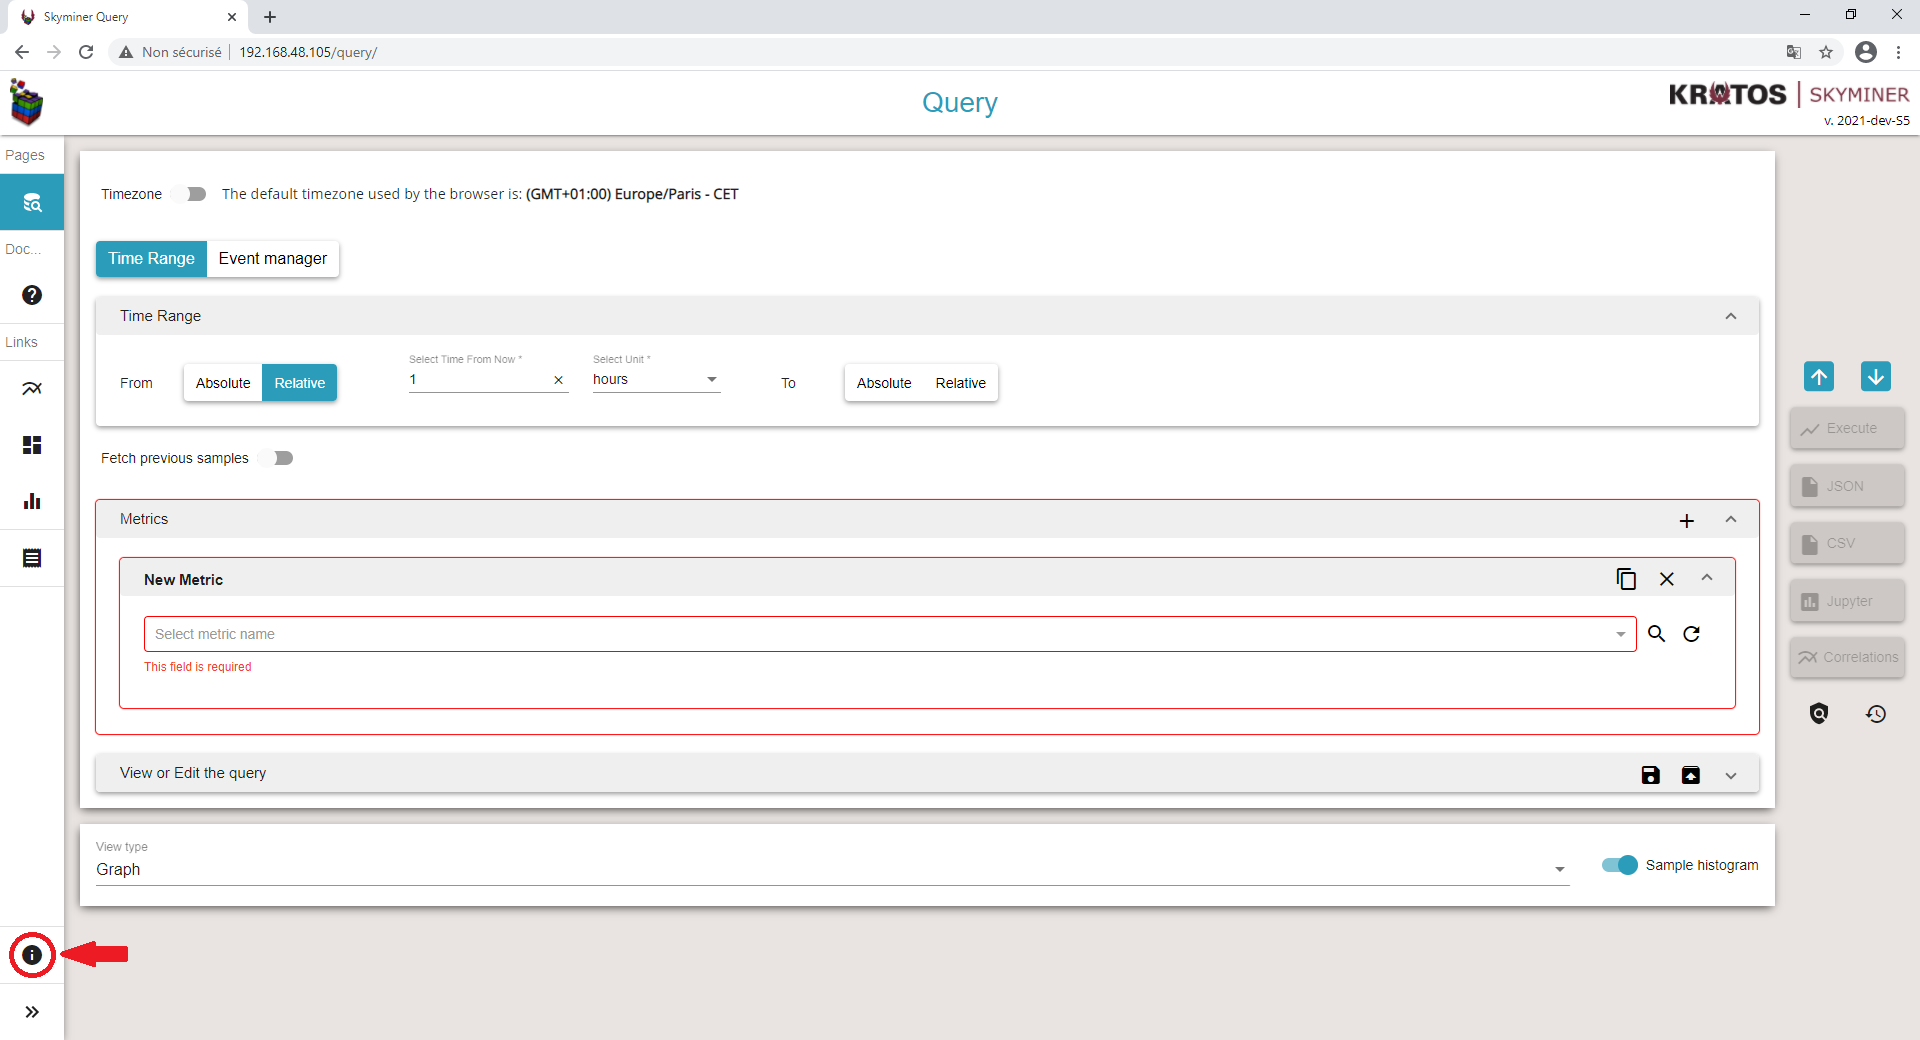
To access the aggregators documentation, click on the information button in the Skyminer Query interface.
Click on the link to “Features documentation”
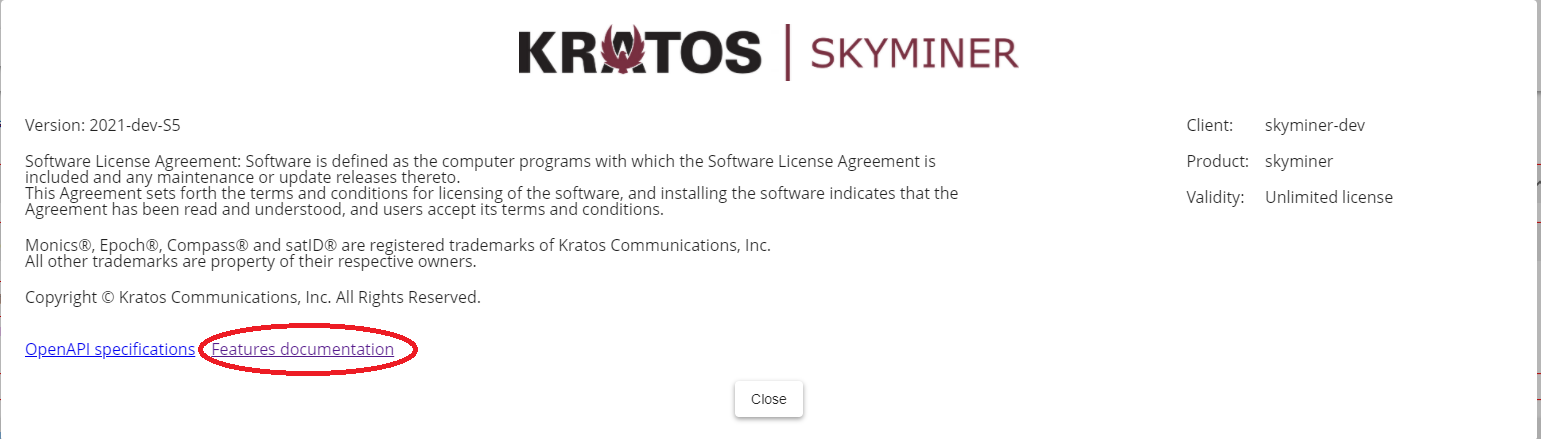
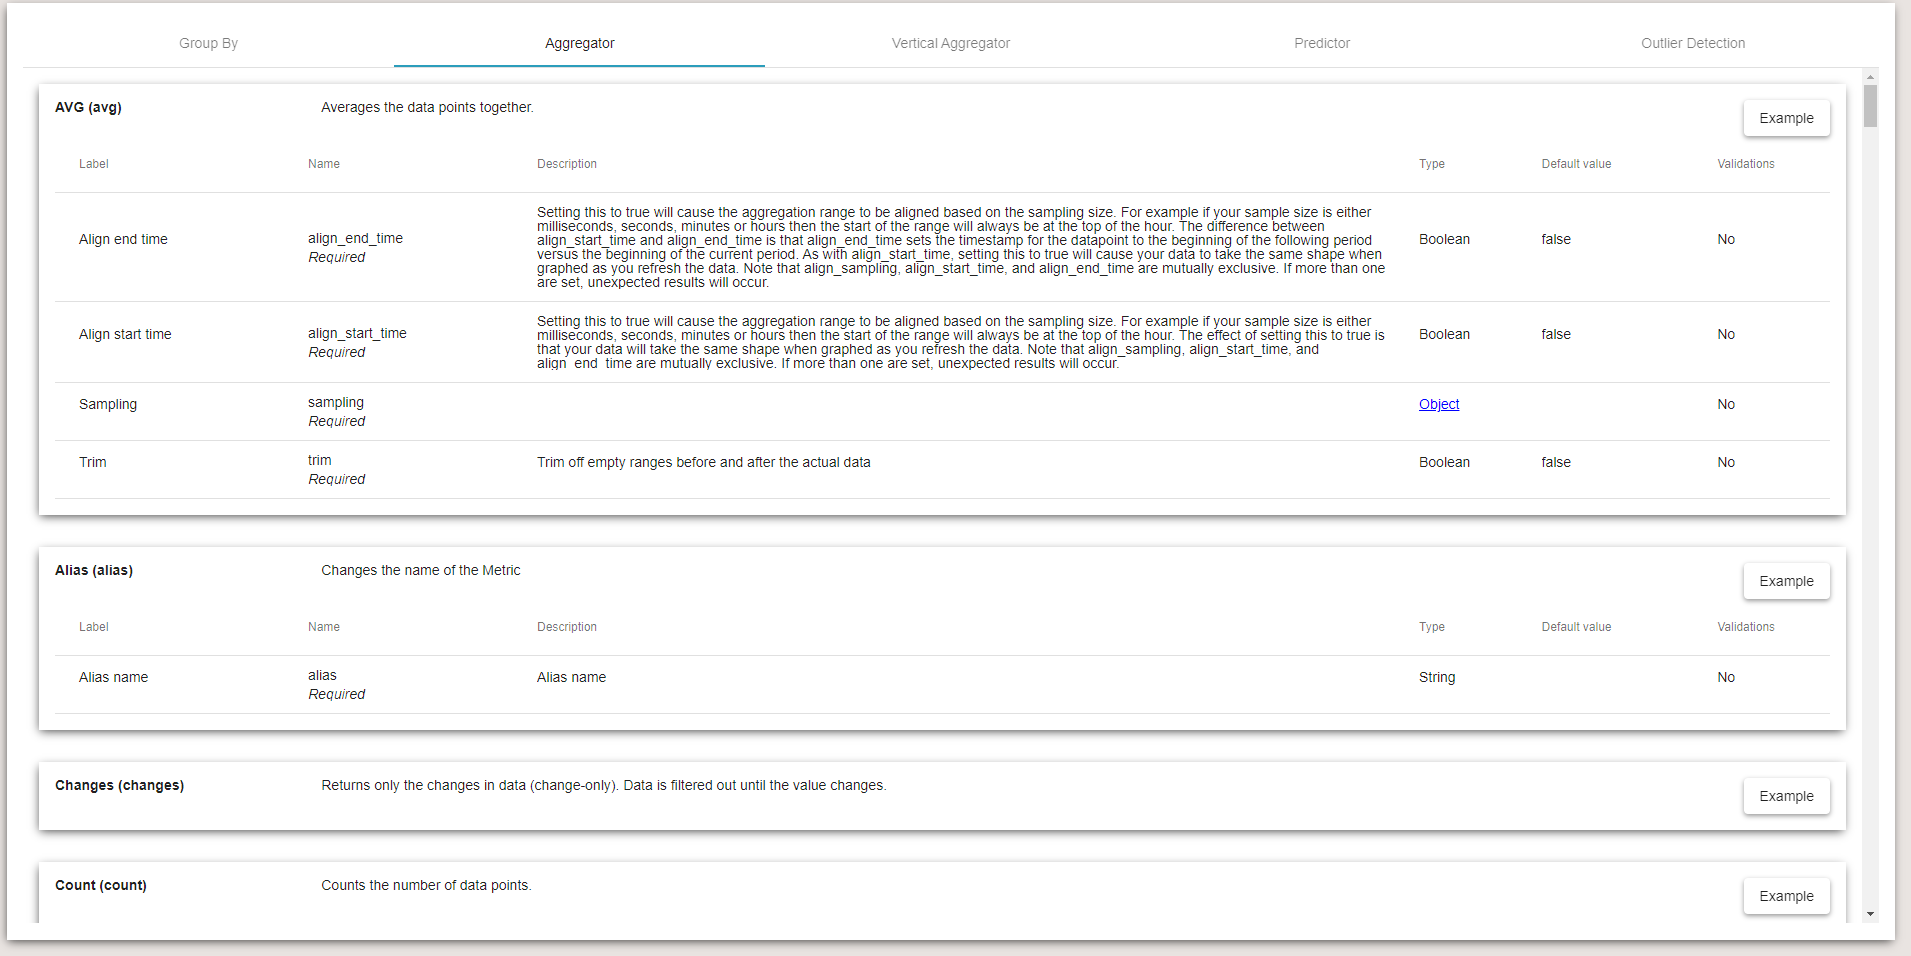
The following window will open, select the tab Aggregator to see details about each aggregator, their use and parameters
Error messages
Type error: the type returned by the script is not a number
{
    "errors": [
        "Script result should be number, got class java.lang.String"
    ]
}
Syntax error: the JavaScript is not valid
{
    "errors": [
        "query.metric[0].aggregators[1].m_script has an invalid syntax:[line & column number] [Syntax error message]"
    ]
}
Allocation limit: the number of points in the range is larger than the maximum size that can be allocated, defined by the skyminer.script_agregator.max_batch property in the configuration file (only occurs if allocate_array is set to true)
{
    "errors": [
        "Number of points in aggregation range exceeds configured limit of 1000"
    ]
}