API
Web services
The API endpoint for queries is /api/v1/datapoints/query.
You should note that some properties that exist in the API are not accessible from the Web UI, mainly for usability reasons.
API online documentation
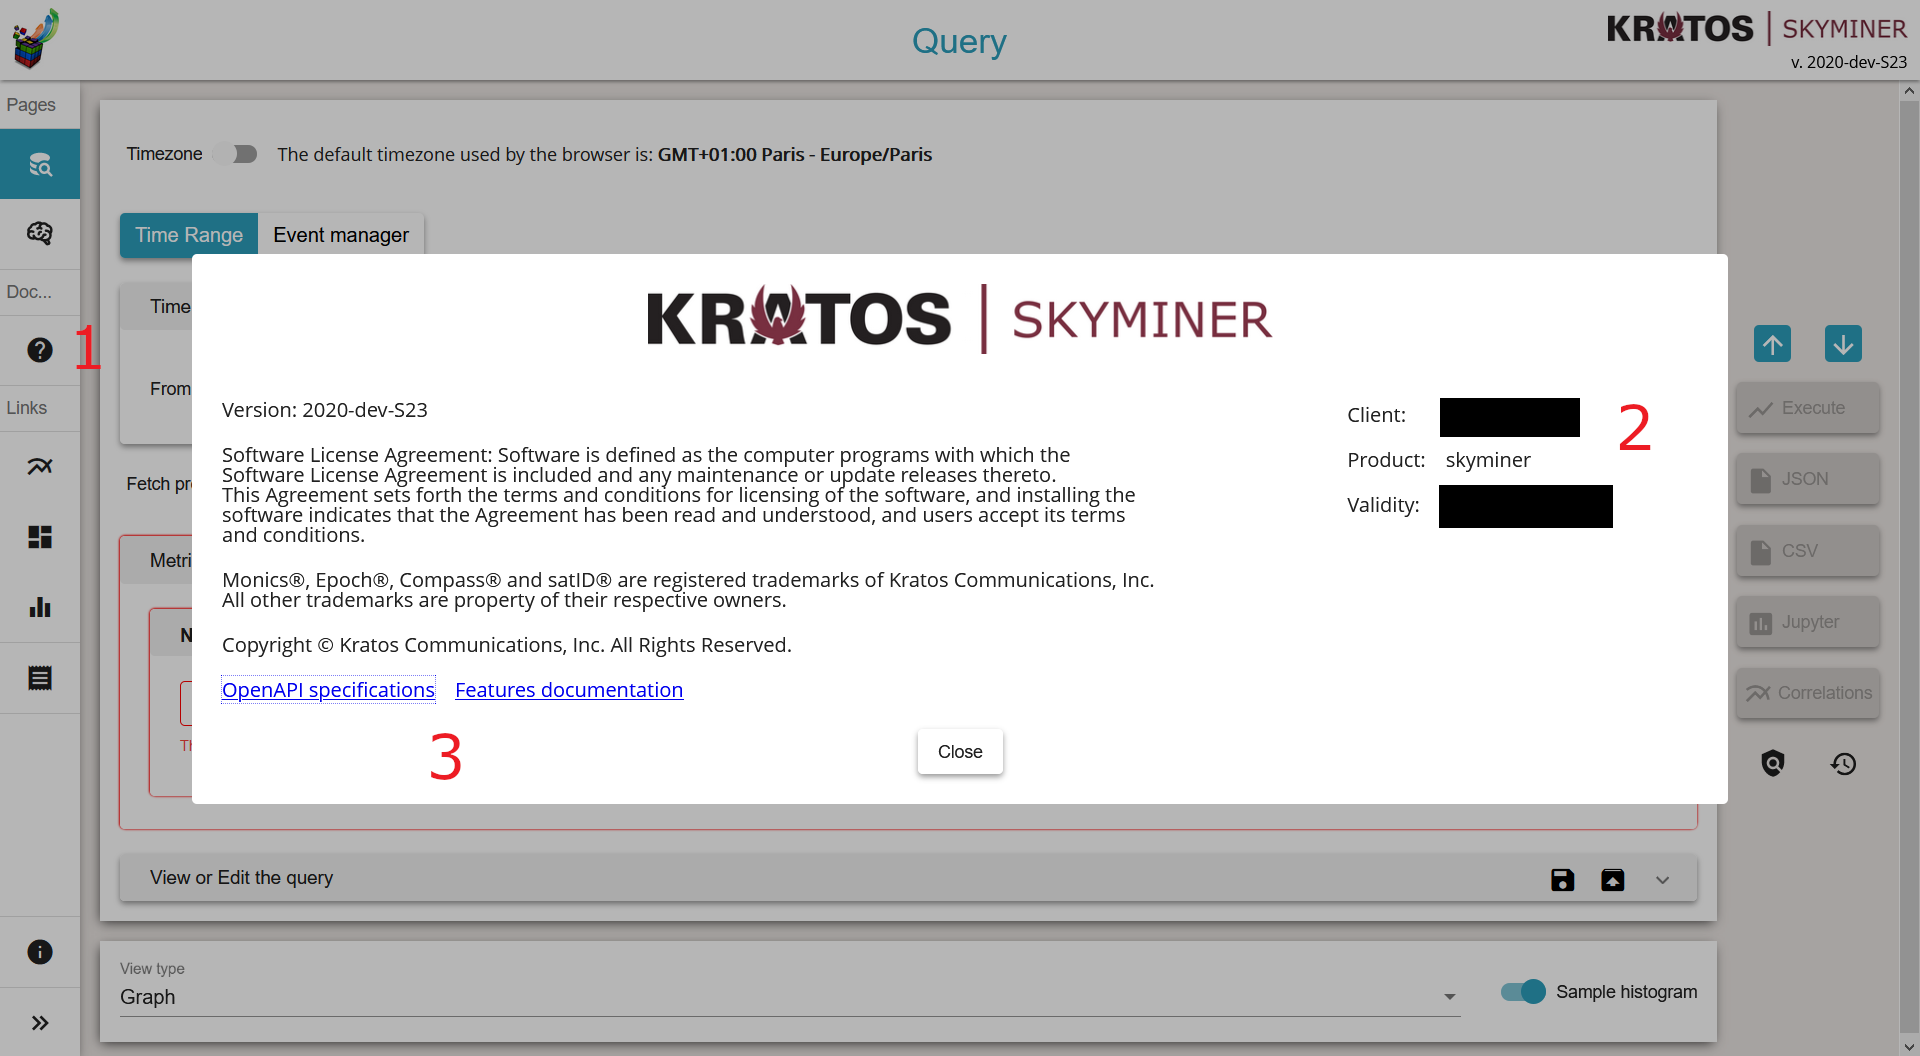
The API documentation is available in the query user interface:
OpenAPi specifications
Features (aggregators, predictors, …) documentation
Links can be found in the About section of the Query page:
Query properties
The global structure of a query is the following one:
Start time (mandatory)
End time (optional)
List of metrics (at least one element)
Cache time (optional)
{
    "start_absolute": 1357023600000,
    "end_relative": {
        "value": "5",
        "unit": "days"
    },
    "cache_time": 0,
    "metrics": [... the list of metrics ...]
}
Time parameters:
You must specify either start_absolute or start_relative but not both. Similarly, you may specify either end_absolute or end_relative but not both. If either end time is not specified the current date and time is assumed.
start_absolute The time in milliseconds.
start_relative The relative start time is the current date and time minus the specified value and unit. Possible unit values are “milliseconds”, “seconds”, “minutes”, “hours”, “days”, “weeks”, “months”, and “years”. For example, if the start time is 5 minutes, the query will return all matching data points for the last 5 minutes.
end_absolute The time in milliseconds. This must be later in time than the start time. If not specified, the end time is assumed to be the current date and time.
end_relative The relative end time is the current date and time minus the specified value and unit. Possible unit values are “milliseconds”, “seconds”, “minutes”, “hours”, “days”, “weeks”, “months”, and “years”. For example, if the start time is 30 minutes and the end time is 10 minutes, the query returns matching data points that occurred between the last 30 minutes up to and including the last 10 minutes. If not specified, the end time is assumed to the current date and time.
Cache time:
The amount of time in seconds to cache the output of the query. If the same query is executed before the cache time expired then cached data is returned.
Metric properties
The query object requires a list of one or more metrics. The metric is an object that always has a name property and optionally can have:
aggregators
vertical_aggregators
predictors
group_by
tags
time_override
limit
group_limit
limit Limits the number of data points returned from the data store. The limit is applied before any aggregator is executed.
group_limit Limits the number of groups returned by the query. The limit is applied before any aggregator is executed.
order Orders the returned data points. Values for order are “asc” for ascending or “desc” for descending. Defaults to ascending. This sorting is done before any aggregators are executed.
The rest of the attributes2 will be described in the subsequent parts.
{
    "tags": {... tags for filtering ...},
    "name": "abc.123",
    "limit": 1000,
    "group_limit": 100,
    "aggregators": [... a list of aggregators ...]
}
Example of complete query
Here is an example of a complete query:
{
    "start_absolute": 1357023600000,
    "end_relative": {
        "value": "5",
        "unit": "days"
    },
    "metrics": [
        {
            "tags": {
                "host": ["foo", "foo2"],
                "type": ["bar"]
            },
            "name": "abc.123",
            "aggregators": [
                {
                    "name": "sum",
                    "sampling": {
                        "value": 10,
                        "unit": "minutes"
                    }
                }
            ]
        },
        {
            "tags": {
                "host": ["foo", "foo2"],
                "type": ["bar"]
            },
            "name": "xyz.123",
            "aggregators": [
                {
                    "name": "avg",
                    "sampling": {
                        "value": 10,
                        "unit": "minutes"
                    }
                }
            ]
        }
    ]
}
Query response
The response contains either the metric values or possible error values. Returns 200 for successful queries.
It always includes a group_by named type. If the data returned is not a custom type then number is returned.
{
  "queries": [
      {
          "sample_size": 14368,
          "results": [
              {
                  "name": "abc_123",
                  "group_by": [
                      {
                         "name": "type",
                         "type": "number"
                      },
                      {
                          "name": "tag",
                          "tags": [
                              "host"
                          ],
                          "group": {
                              "host": "server1"
                          }
                      }
                  ],
                  "tags": {
                      "host": [
                          "server1"
                      ],
                      "customer": [
                          "bar"
                      ]
                  },
                  "values": [
                      [
                          1364968800000,
                          11019
                      ],
                      [
                          1366351200000,
                          2843
                      ]
                  ]
              }
          ]
      }
  ]

}
Failure
{
    "errors": [
        "metrics[0].sampling.unit must be one of  SECONDS,MINUTES,HOURS,DAYS,WEEKS,YEARS"
    ]
}