Legacy Web interface
The query builder
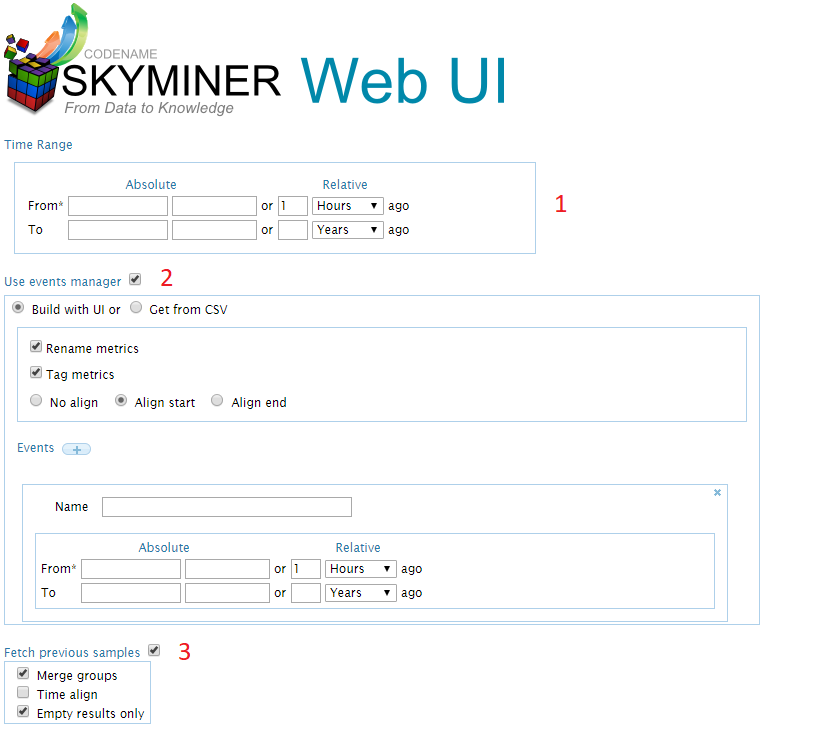
Time range of the query. It can be expressed either as a time relative to the current date (for instance 1 hour ago) or as an absolute date by picking in the calendar.
The event builder. It is a tool that allows the user to duplicate metrics to fetch the data at different times.
Previous samples, this option is designed to retrieve the last known value of the query.
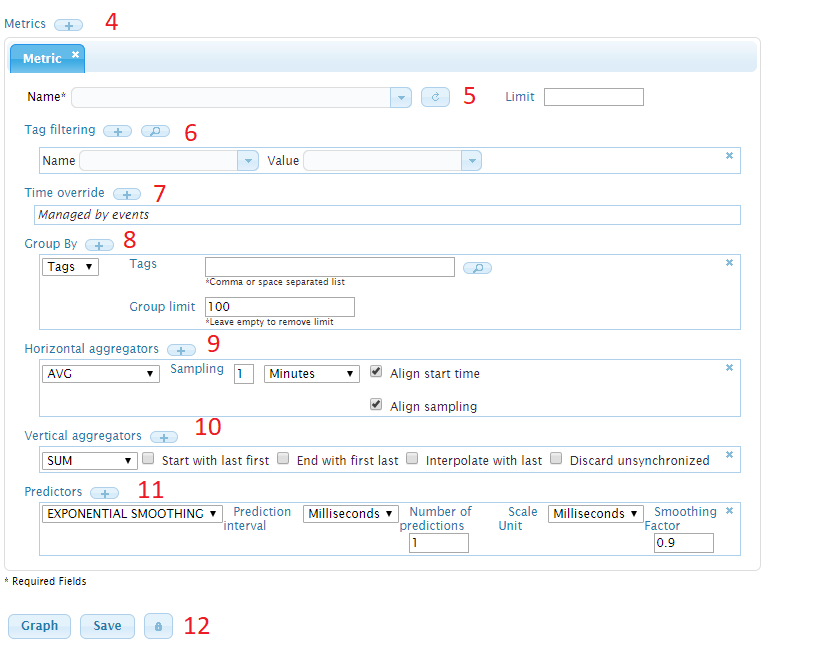
Add or copy a metric . A single query can have different metrics or query the same metric with different processing. When you choose to copy a metric, the selected one is copied.
This field is the name of the metric to query. A metric is a group of data points, typically referring to a specific input (example: temperature, cpu usage …). Inside a given metric, different series can be differentiated by tags. Auto-completion in the text field helps you to find stored metrics. It is the only mandatory field of the query.
Tag filtering allows you to select pairs of tag name and value that you want to filter against. All the data points that do not have these tags will be discarded.
Time Override
Group By allows you to split your metric into different series.
Tag grouping separates the data points into different series according to the value of a given tag.
Time grouping separates the data points into series according to time intervals. The count attribute specifies the number of time groups. For instance a Target Size of 1 day with a group count of 7 will put all the data points of every day of the week into a different group.
Value grouping separates the data points into groups according to their value. The Target Size attribute must be a positive integer. It specifies the size of the interval of each value group, the first group starting at 0.
Horizontal aggregation will apply mathematical operations on each group independently. Some aggregators (like mean, sum, average…) diminish the number of samples by creating summary statistics on time intervals. They are crucial when querying frequently sampled time series on long time intervals, otherwise the number of points returned by the server becomes huge and cannot be handled by the server.
Vertical aggregation applies operations between time series groups. They are important when you have a large number of groups after the grouping operation.
Predictors are forecasting tools. They return series that have timestamps after the timestamp of the original series.
You can choose to either graph the data directly in the web UI or to save the text result. You can save it either in Json format, which is the original format of the response returned from the server, or in CSV, for further processing. The lock button defines limits on the query. The user can change these limits to be able to submit exceptionally large queries.
The resulting query
Once the query is executed (either graphed or saved), the query in Json format (by default, you can also choose to display it in js Object) appears in the text box.
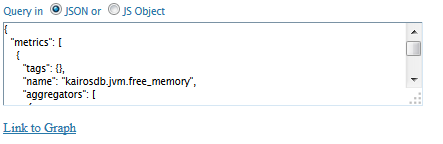
You can decide to create a graph directly from a JSON query without going through the query builder.
Generated graph
If the graph button has been clicked, the resulting series are plotted.
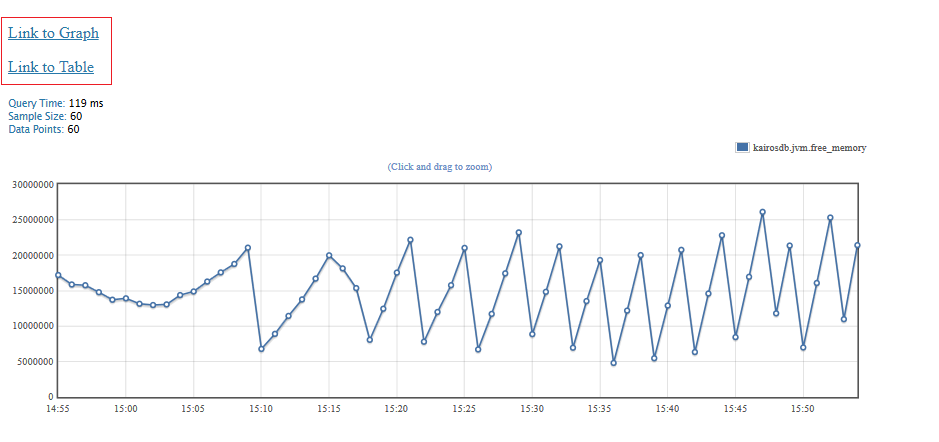
You can get a link to the graph. It is a way to save the query and re-execute it at any time by pasting the URL in your web browser. A link to table is also available, it allows you to see the last values of your metric in a table view.
The indicator called Sample Size represents the number of data points that were processed by the query, before aggregation. Data Points are the objects actually returned in the response and plotted after aggregation.
Important remark: when building a query, you should always be careful to aggregate your series in a way that there are not to many data points that are returned. Average and sum aggregators are often the most appropriate to concentrate the database into shorter time series. Plotting a large number of points is rarely informative.