Metrics
Overview
Metrics section, a single query can have different metrics or query the same metric with different processing.
Description
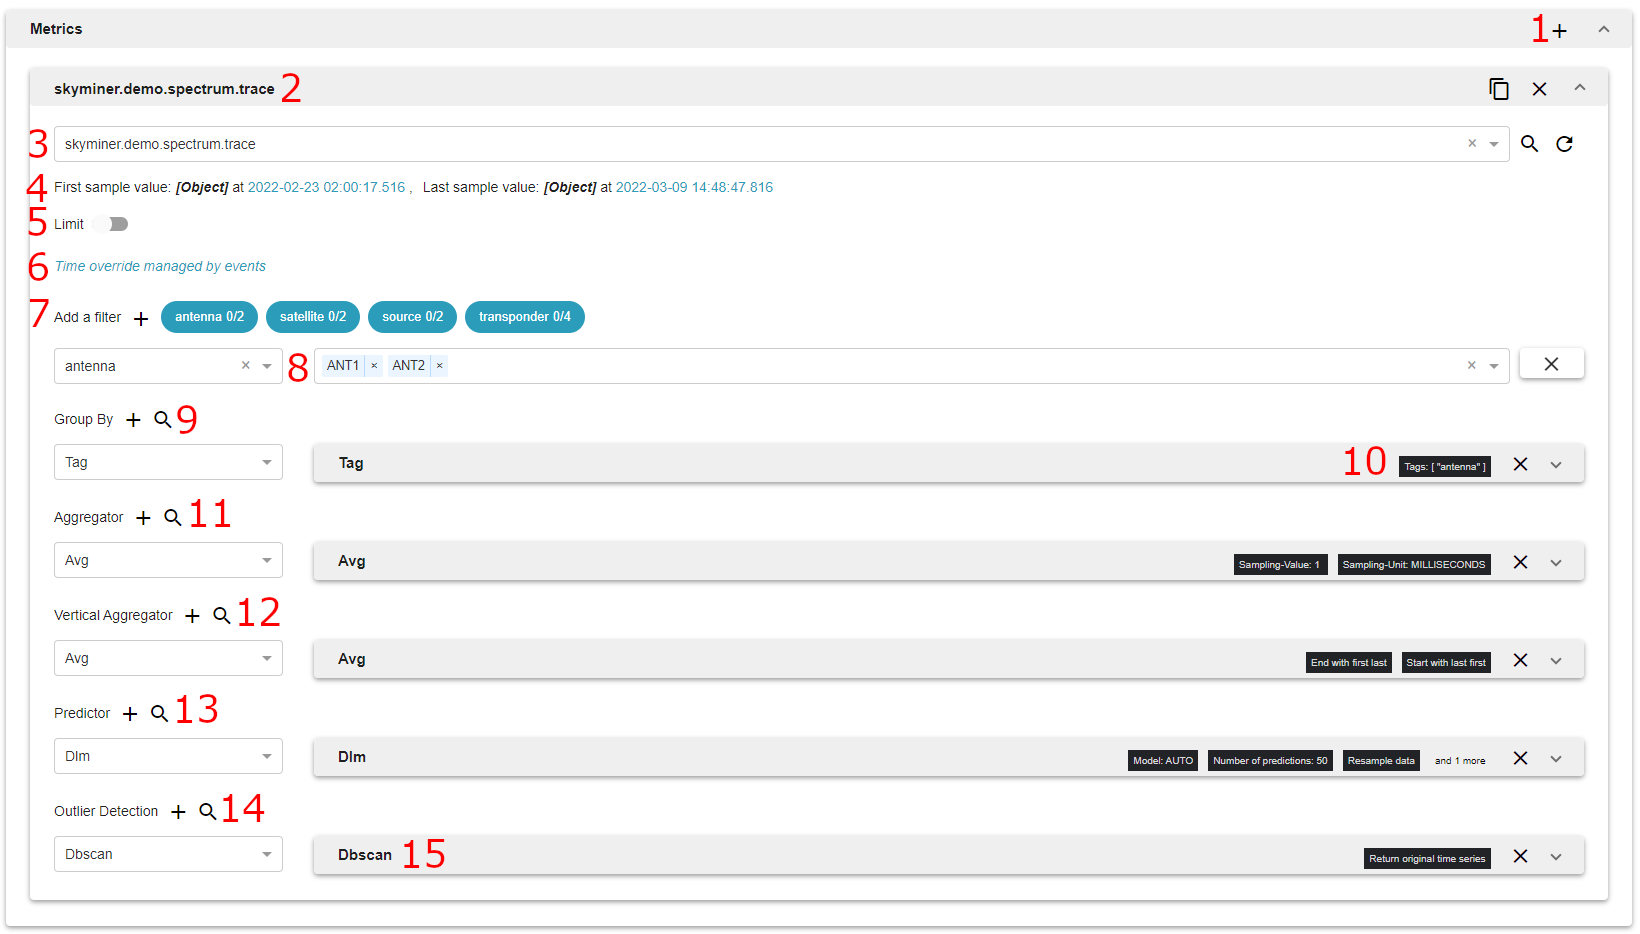
The + button allows you to add a new empty metric to the list.
Metric, this section can also be toggled to display metric information or hide it. There are three buttons on the right, the first one allows you to replicate the processing chain to other metrics, the second one to duplicate this metric and the third one to delete this metric.
This field is the name of the metric to query. A metric is a group of data points, typically referring to a specific input (example: temperature, cpu usage …). Inside a given metric, different series can be identified by tags. Auto-completion in the text field helps you to find stored metrics. A metric advanced search is available by clicking the magnifier button. It is the only mandatory field of the query.
This line shows to the user whether data are available for the picked metric. If there is data the line shows the time and the value of the first and last sample. Times are clickable and can be used to set the start and the end of the absolute time range.
This field can be used to set a limit for metric data. Only the N first data will be returned by the API.
Time Override
Tag filtering allows you to select pairs of tag names and values that you want to filter against. All data points that do not match these tags will be discarded.
You can add a filter via the tag explorer or with two select inputs.
Group By allows you to split your metric into different series.
Tag: grouping separates the data points into different series according to the value of a given tag.
Bin: grouping data by bins or buckets.
Calendar: grouping data by calendar period (e.g. day of the week, day of the month, year …).
Fiscal period: grouping data by fiscal period.
Time: grouping separates the data points into series according to time intervals. The count attribute specifies the number of time groups. For instance a Target Size of 1 day with a group count of 7 will put all the data points of each day of the week into a different group.
Value: grouping separates the data points into groups according to their value. The Target Size attribute must be a positive integer. It specifies the size of the interval of each value group, with the first group starting at 0.
When a feature is minimized you can still have information on the content.
Horizontal aggregation will apply mathematical operations on each group independently. Some aggregators (like mean, sum, average…) diminish the number of samples by creating summary statistics on time intervals. They are crucial when querying frequently sampled time series on long time intervals, otherwise the number of points returned by the server becomes huge and cannot be handled.
Vertical aggregation applies operations between time series groups. They are important when you have a large number of groups after the grouping operation.
Predictors are forecasting tools. They return series that have timestamps after the timestamp of the original series.
Anomaly detection contains tools that return a time series that represents the anomalies of the series it is applied on.
You can display information on the feature you add by clicking on the question mark.