Outlier Detection
Outlier detectors work just like predictors except that they return a time series that represents the anomalies of the series it is applied on.
Two outlier detectors are currently implemented:
Outliers DBScan
Grubbs’s Test
Grubbs’s Test
The Grubbs’s test detector is an outlier detection algorithm. It detects maximums and minimums outliers on a time series.
The Grubbs’s test algorithm is computationally slow for series greater than 70 000 points. The cost of this algorithm is linear relative to the time series size.
It detects anomalies in two steps. First it removes the trend and the seasonality of the time series, then it computes Grubbs’s Test algorithm.
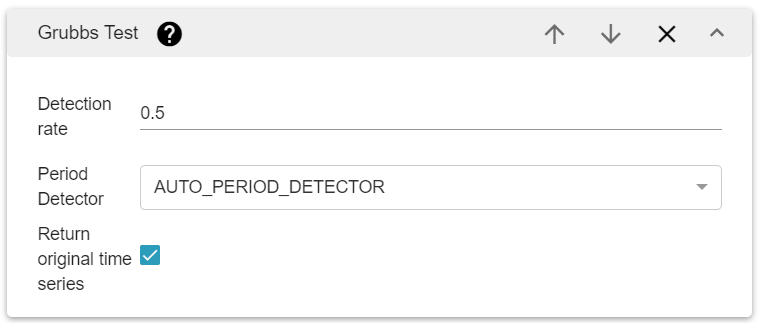
There are three parameters for the Grubb’s tester algorithm:
The algorithm used to detect the period of the time series (if there is one). You should use AUTO_PERIOD_DETECTOR by default which works for any type of time series with more accuracy. However, it costs more than the other detectors.
The percentile of acceptation of the outlier (between 0 and 1).
A boolean to return the time series with the outlier detection or not.
This algorithm detects outlier based on the data of the time series. If your time series doesn’t contain a lot of data point, anomalies can be missed. The Grubbs’s test defines a threshold which can be less relevant on series with few data points.
For more information about period detection algorithms, see: On Periodicity Detection and Structural Periodic Similarity IBM T.J. Watson Research Center (AUTO_PERIOD), A FULLY AUTOMATED PERIODICITY DETECTION IN TIME SERIE (ACF)
DBSCAN
Density-based spatial clustering of applications with noise (DBSCAN) is a data clustering algorithm. It can be used to find anomalies in a single or multiple groups of data.
steps:
Find the points in the ε (epsilon) neighborhood of every point, and identify the core points with more than minPts neighbors.
Find the connected components of core points on the neighbor graph, ignoring all non-core points.
Assign each non-core point to a nearby cluster if the cluster is an ε (eps) neighbor, otherwise consider it as outlier
Therefore, for detecting anomalies it retains the points that do not belong to any cluster.
Advantages
DBSCAN works using multiple data groups, and is able to indicate the groups having outliers
DBSCAN does not require one to specify the number of clusters in the data a priori, as opposed to most other clustering algorithms like K-Means.
DBSCAN can find arbitrarily shaped clusters.
DBSCAN has a notion of noise, and is robust to outliers.
The parameters minPts and ε can be set by a domain expert, if the data is well understood.
Disadvantages
The distance measure is euclidean distance. The time dimension can be scaled to overcome this limitation on the time axis.
DBSCAN cannot cluster data sets well with large differences in densities, since the minPts-ε combination cannot then be chosen appropriately for all clusters.[8]
If the data and scale are not well understood, choosing a meaningful distance threshold ε can be difficult. To help using this feature, ε can be estimated by a distribution algorithm.
Time scale methods
Time scale methods define how DBSCAN algorithm shoul consider the distance between points in time dimension.
TIME_SCALE_FULL_RANGE: Considers that the time dimension has the same variability of the entire data set. i.e (maxTime-minTime)*time_scale_factor is equivalent to maxValue-minValueTIME_SCALE_AVERAGE_SAMPLING_RATE: Computes average time period between points. Then considers that the time dimension has the same variability of the entire data set. i.e average_sampling_rate*time_scale_factor is equivalent to maxValue-minValueTIME_SCALE_PROVIDED_FACTOR: Uses only provided factor: i.e. distance in time dimension is equals to time difference in milliseconds multiplied by this factorIGNORE_TIME_DIMENSION: time dimension is not used to compute distance between points
Standard Deviation Test
The standard deviation test detects outliers by analyzing the distance of each data point to the average value of the time series. It uses all data groups and returns outliers within their respective groups.
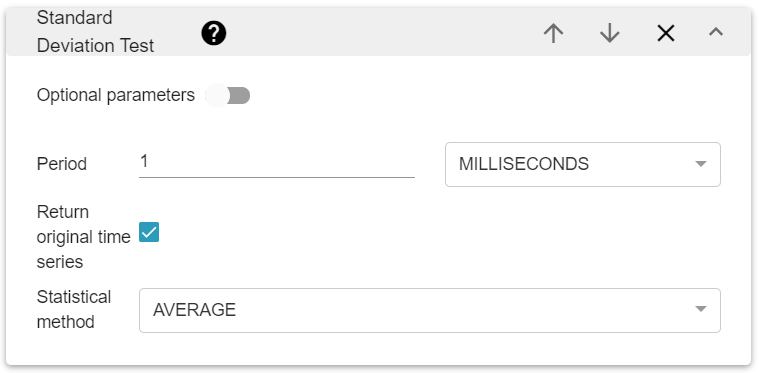
There are four parameters for this algorithm:
The statistical method used as a baseline to detect outliers. Possible values are AVERAGE, MOVING_AVERAGE and MOVING_MEDIAN
The time period over which the statistical method is applied
The standard deviation threshold, which sets the sensitivity of the outlier detection
A boolean to return the time series with the outlier detection or not.